Chapter 42 HCA human bone marrow (10X Genomics)
42.1 Introduction
Here, we use an example dataset from the Human Cell Atlas immune cell profiling project on bone marrow, which contains scRNA-seq data for 380,000 cells generated using the 10X Genomics technology. This is a fairly big dataset that represents a good use case for the techniques in Chapter 23.
42.2 Data loading
This dataset is loaded via the HCAData package, which provides a ready-to-use SingleCellExperiment object.
library(HCAData)
sce.bone <- HCAData('ica_bone_marrow')
sce.bone$Donor <- sub("_.*", "", sce.bone$Barcode)
We use symbols in place of IDs for easier interpretation later.
42.3 Quality control
Cell calling was not performed (see here) so we will perform QC using all metrics and block on the donor of origin during outlier detection. We perform the calculation across multiple cores to speed things up.
library(BiocParallel)
bpp <- MulticoreParam(8)
sce.bone <- unfiltered <- addPerCellQC(sce.bone, BPPARAM=bpp,
    subsets=list(Mito=which(rowData(sce.bone)$Chr=="MT")))

qc <- quickPerCellQC(colData(sce.bone), batch=sce.bone$Donor,
    sub.fields="subsets_Mito_percent")
sce.bone <- sce.bone[,!qc$discard]unfiltered$discard <- qc$discard
gridExtra::grid.arrange(
plotColData(unfiltered, x="Donor", y="sum", colour_by="discard") +
scale_y_log10() + ggtitle("Total count"),
plotColData(unfiltered, x="Donor", y="detected", colour_by="discard") +
scale_y_log10() + ggtitle("Detected features"),
plotColData(unfiltered, x="Donor", y="subsets_Mito_percent",
colour_by="discard") + ggtitle("Mito percent"),
ncol=2
)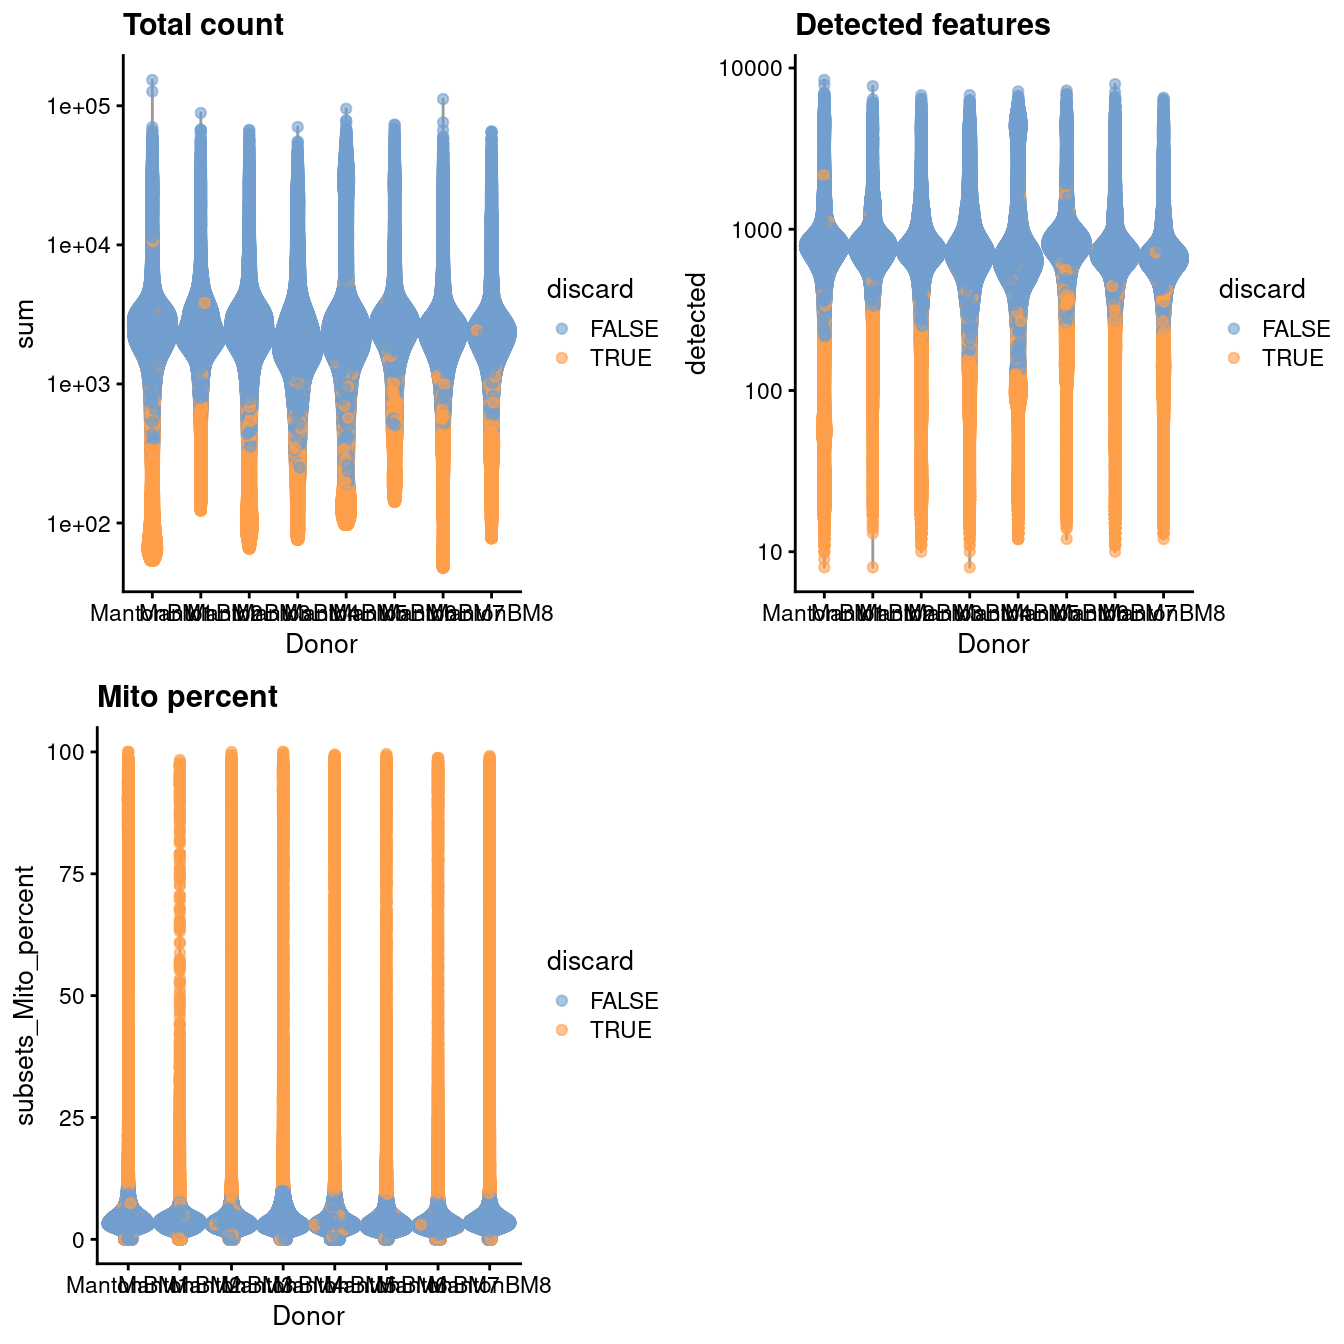
Figure 42.1: Distribution of QC metrics in the HCA bone marrow dataset. Each point represents a cell and is colored according to whether it was discarded.
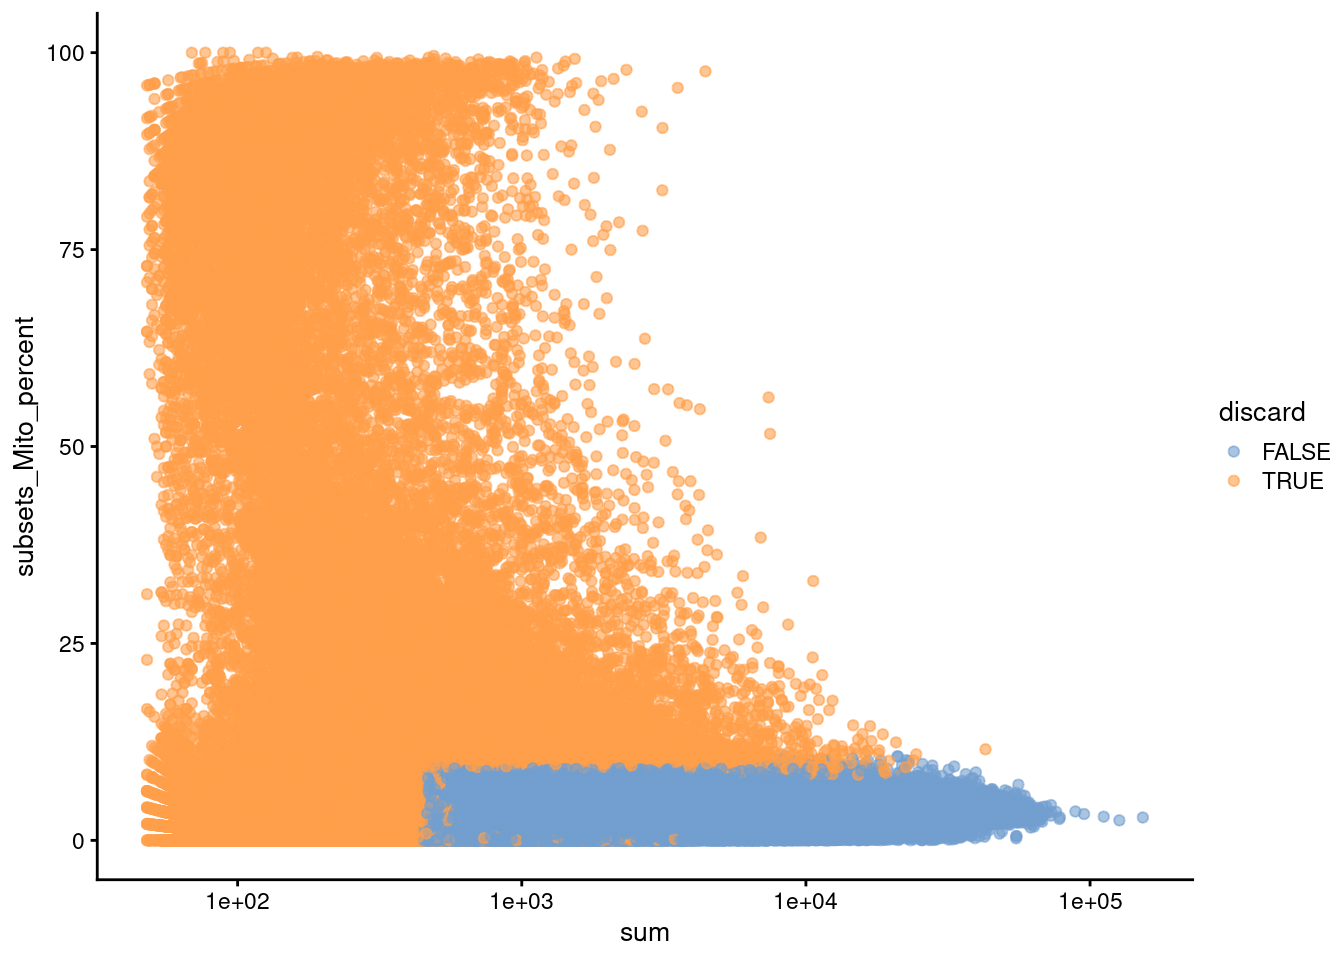
Figure 42.2: Percentage of mitochondrial reads in each cell in the HCA bone marrow dataset compared to its total count. Each point represents a cell and is colored according to whether that cell was discarded.
42.4 Normalization
For a minor speed-up, we use already-computed library sizes rather than re-computing them from the column sums.
##    Min. 1st Qu.  Median    Mean 3rd Qu.    Max.
##    0.05    0.47    0.65    1.00    0.89   42.38
42.5 Variance modeling
We block on the donor of origin to mitigate batch effects during HVG selection. We select a larger number of HVGs to capture any batch-specific variation that might be present.
library(scran)
set.seed(1010010101)
dec.bone <- modelGeneVarByPoisson(sce.bone,
    block=sce.bone$Donor, BPPARAM=bpp)
top.bone <- getTopHVGs(dec.bone, n=5000)par(mfrow=c(4,2))
blocked.stats <- dec.bone$per.block
for (i in colnames(blocked.stats)) {
current <- blocked.stats[[i]]
plot(current$mean, current$total, main=i, pch=16, cex=0.5,
xlab="Mean of log-expression", ylab="Variance of log-expression")
curfit <- metadata(current)
curve(curfit$trend(x), col='dodgerblue', add=TRUE, lwd=2)
}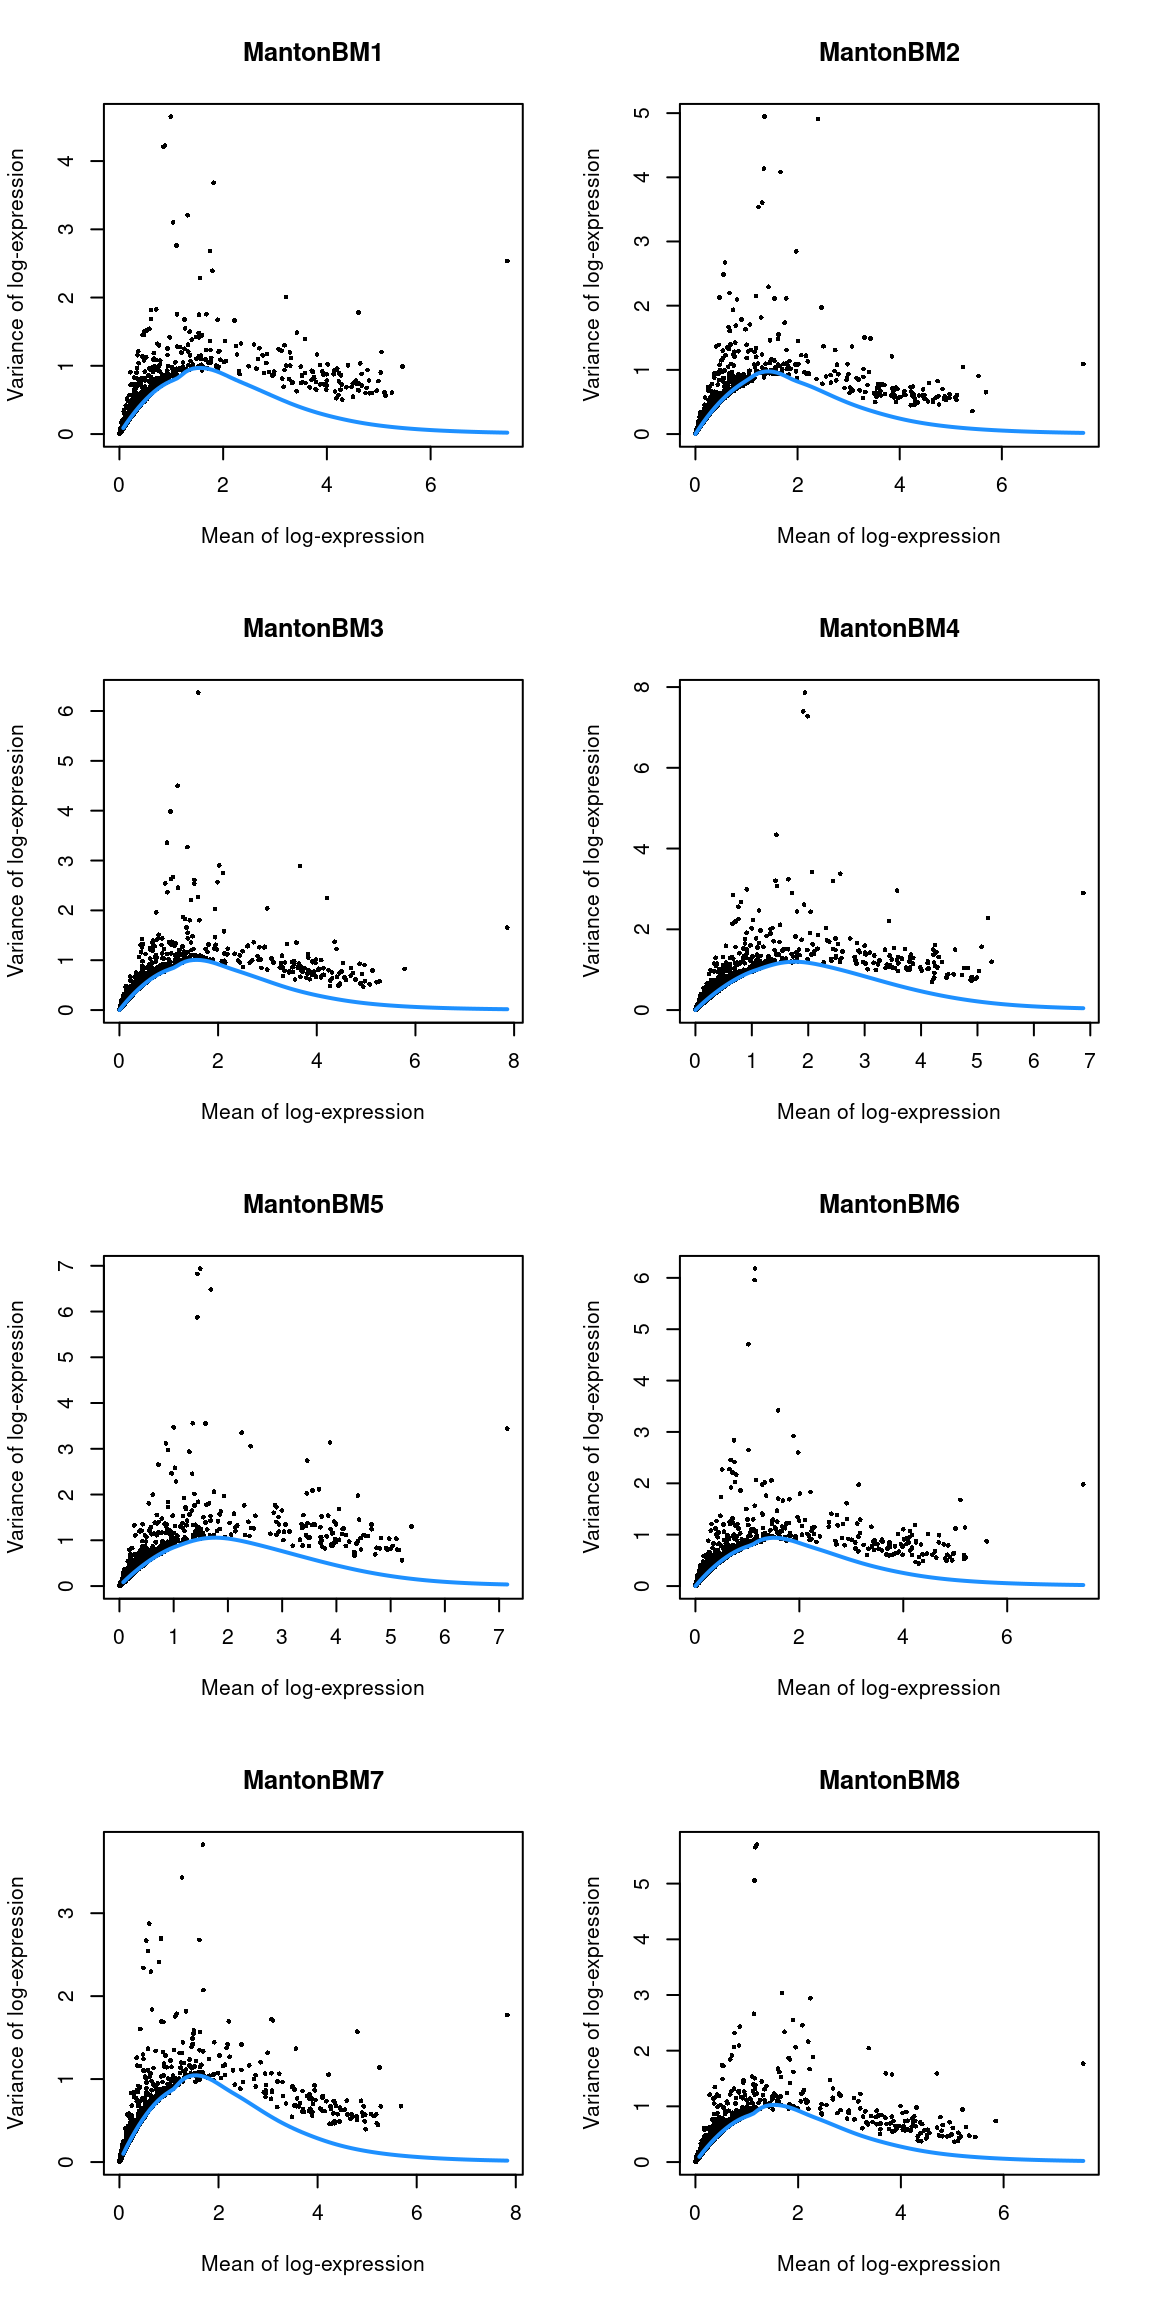
Figure 42.3: Per-gene variance as a function of the mean for the log-expression values in the HCA bone marrow dataset. Each point represents a gene (black) with the mean-variance trend (blue) fitted to the variances.
42.6 Data integration
Here we use multiple cores, randomized SVD and approximate nearest-neighbor detection to speed up this step.
library(batchelor)
library(BiocNeighbors)

set.seed(1010001)
merged.bone <- fastMNN(sce.bone, batch = sce.bone$Donor, subset.row = top.bone,
     BSPARAM=BiocSingular::RandomParam(deferred = TRUE),
     BNPARAM=AnnoyParam(),
     BPPARAM=bpp)

reducedDim(sce.bone, 'MNN') <- reducedDim(merged.bone, 'corrected')
We use the percentage of variance lost as a diagnostic measure:
##      MantonBM1 MantonBM2 MantonBM3 MantonBM4 MantonBM5 MantonBM6 MantonBM7
## [1,]  0.006925  0.006387  0.000000  0.000000  0.000000  0.000000  0.000000
## [2,]  0.006376  0.006853  0.023099  0.000000  0.000000  0.000000  0.000000
## [3,]  0.005068  0.003070  0.005132  0.019471  0.000000  0.000000  0.000000
## [4,]  0.002006  0.001873  0.001898  0.001780  0.023112  0.000000  0.000000
## [5,]  0.002445  0.002009  0.001780  0.002923  0.002634  0.023804  0.000000
## [6,]  0.003106  0.003178  0.003068  0.002581  0.003283  0.003363  0.024562
## [7,]  0.001939  0.001677  0.002427  0.002013  0.001555  0.002270  0.001969
##      MantonBM8
## [1,]   0.00000
## [2,]   0.00000
## [3,]   0.00000
## [4,]   0.00000
## [5,]   0.00000
## [6,]   0.00000
## [7,]   0.03213
42.7 Dimensionality reduction
We set external_neighbors=TRUE to replace the internal nearest neighbor search in the UMAP implementation with our parallelized approximate search.
We also set the number of threads to be used in the UMAP iterations.
42.8 Clustering
Graph-based clustering generates an excessively large intermediate graph so we will instead use a two-step approach with \(k\)-means.
We generate 1000 small clusters that are subsequently aggregated into more interpretable groups with a graph-based method.
If more resolution is required, we can increase centers in addition to using a lower k during graph construction.
library(bluster)

set.seed(1000)
colLabels(sce.bone) <- clusterRows(reducedDim(sce.bone, "MNN"),
    TwoStepParam(KmeansParam(centers=1000), NNGraphParam(k=5)))

table(colLabels(sce.bone))
##
## 1 2 3 4 5 6 7 8 9 10 11 12 13
## 65896 47244 30659 37110 7039 10193 18585 17064 26262 8870 7993 7968 3732
## 14 15 16 17 18 19
## 3685 4993 11048 3161 3024 2199We observe mostly balanced contributions from different samples to each cluster (Figure 42.4), consistent with the expectation that all samples are replicates from different donors.
tab <- table(Cluster=colLabels(sce.bone), Donor=sce.bone$Donor)
library(pheatmap)
pheatmap(log10(tab+10), color=viridis::viridis(100))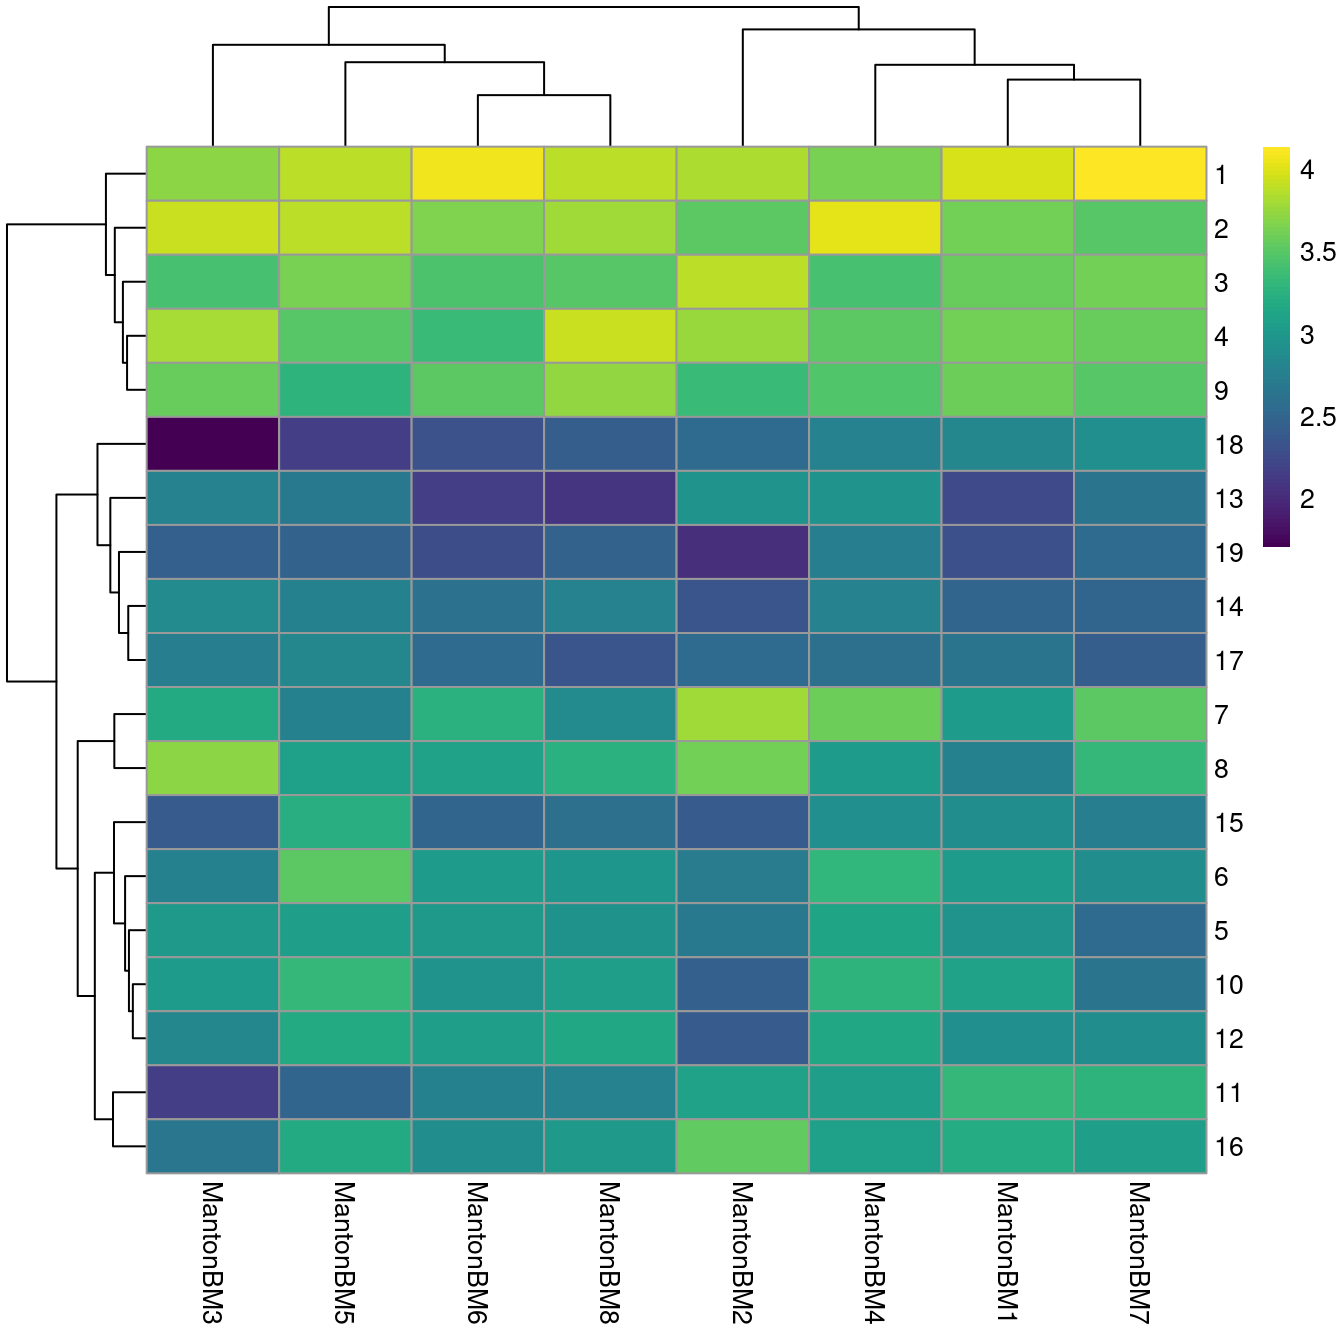
Figure 42.4: Heatmap of log10-number of cells in each cluster (row) from each sample (column).
# TODO: add scrambling option in scater's plotting functions.
scrambled <- sample(ncol(sce.bone))

gridExtra::grid.arrange(
    plotUMAP(sce.bone, colour_by="label", text_by="label"),
    plotUMAP(sce.bone[,scrambled], colour_by="Donor")
)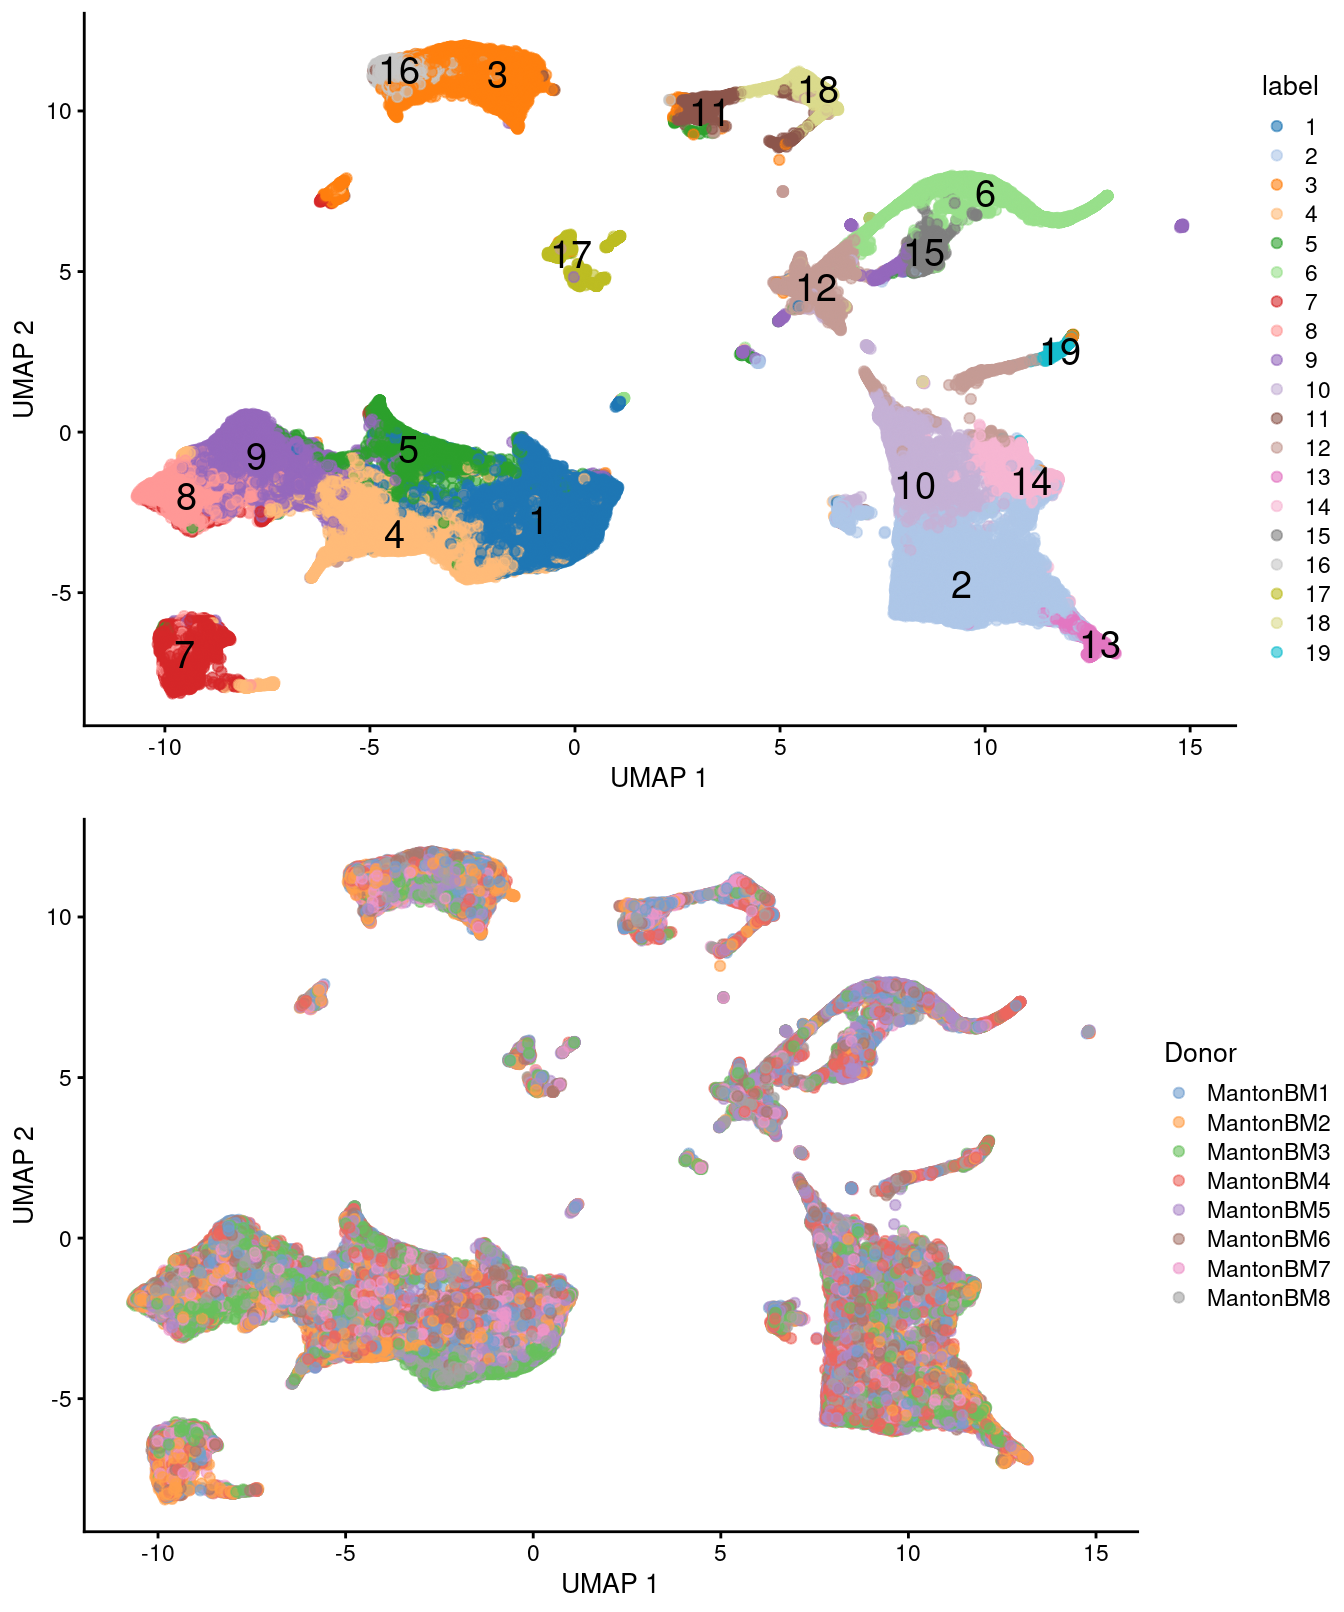
Figure 42.5: UMAP plots of the HCA bone marrow dataset after merging. Each point represents a cell and is colored according to the assigned cluster (top) or the donor of origin (bottom).
42.9 Differential expression
We identify marker genes for each cluster while blocking on the donor.
markers.bone <- findMarkers(sce.bone, block = sce.bone$Donor,
    direction = 'up', lfc = 1, BPPARAM=bpp)
We visualize the top markers for a randomly chosen cluster using a “dot plot” in Figure 42.6. The presence of upregulated genes like LYZ, S100A8 and VCAN is consistent with a monocyte identity for this cluster.
top.markers <- markers.bone[["2"]]
best <- top.markers[top.markers$Top <= 10,]
lfcs <- getMarkerEffects(best)

library(pheatmap)
pheatmap(lfcs, breaks=seq(-5, 5, length.out=101))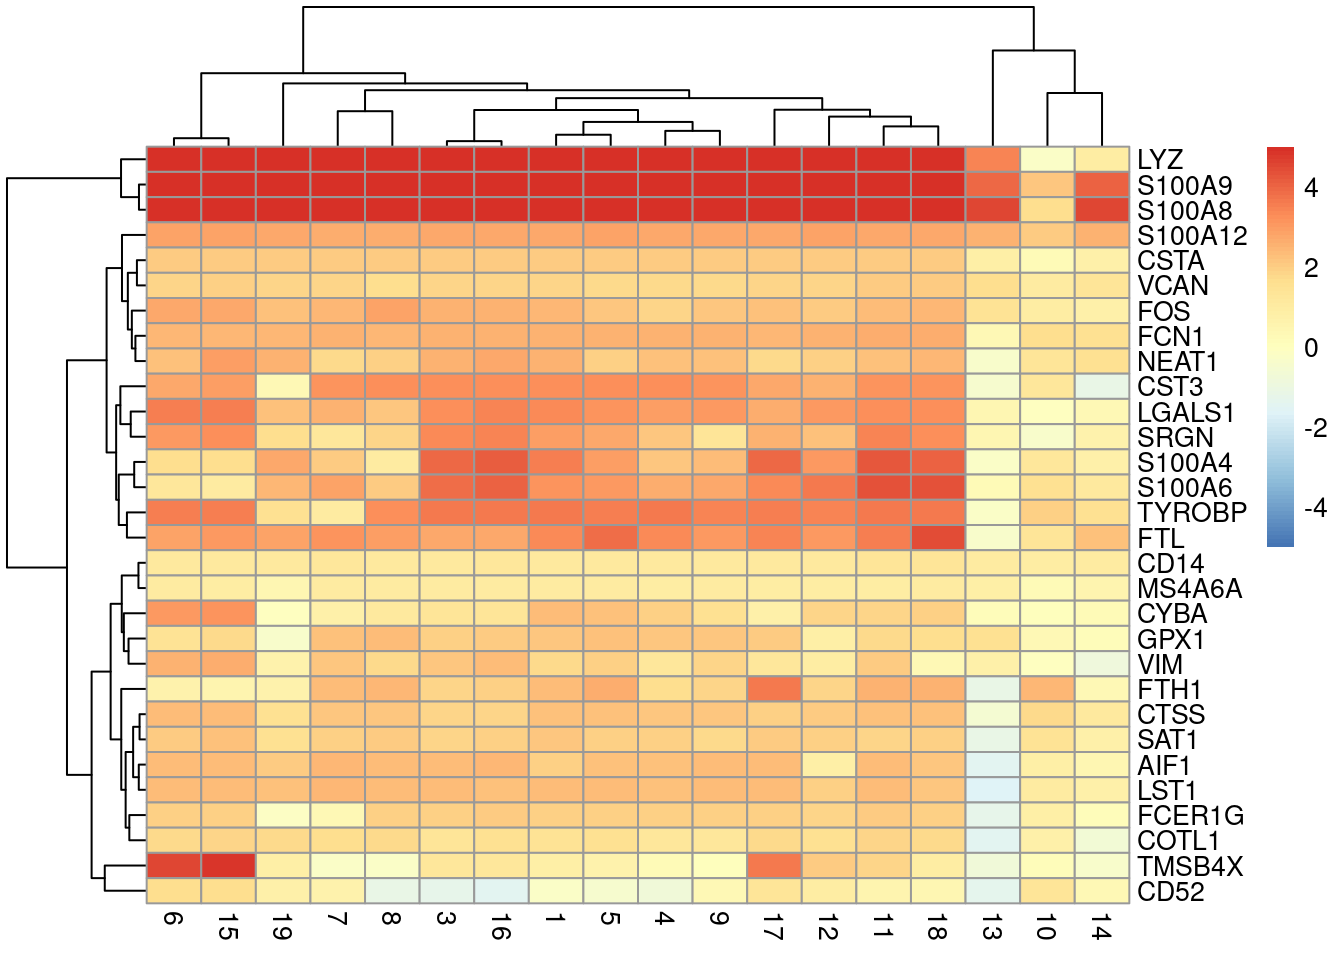
Figure 42.6: Heatmap of log2-fold changes for the top marker genes (rows) of cluster 2 compared to all other clusters (columns).
42.10 Cell type classification
We perform automated cell type classification using a reference dataset to annotate each cluster based on its pseudo-bulk profile. This is faster than the per-cell approaches described in Chapter 12 at the cost of the resolution required to detect heterogeneity inside a cluster. Nonetheless, it is often sufficient for a quick assignment of cluster identity, and indeed, cluster 2 is also identified as consisting of monocytes from this analysis.
se.aggregated <- sumCountsAcrossCells(sce.bone, id=colLabels(sce.bone))

library(celldex)
hpc <- HumanPrimaryCellAtlasData()

library(SingleR)
anno.single <- SingleR(se.aggregated, ref = hpc, labels = hpc$label.main,
    assay.type.test="sum")
anno.single
## DataFrame with 19 rows and 5 columns
## scores first.labels tuning.scores
## <matrix> <character> <DataFrame>
## 1 0.325925:0.652679:0.575563:... T_cells 0.691160:0.1929391
## 2 0.296605:0.741579:0.529038:... Pre-B_cell_CD34- 0.565504:0.2473908
## 3 0.311871:0.672003:0.539219:... B_cell 0.621882:0.0147466
## 4 0.335035:0.658920:0.580926:... T_cells 0.643977:0.3972014
## 5 0.333016:0.614727:0.522212:... T_cells 0.603456:0.4050120
## ... ... ... ...
## 15 0.380959:0.683493:0.784153:... MEP 0.376779:0.374257
## 16 0.309959:0.666660:0.548568:... B_cell 0.775892:0.716429
## 17 0.367825:0.654503:0.580287:... B_cell 0.530394:0.327330
## 18 0.409967:0.708583:0.643723:... Pro-B_cell_CD34+ 0.851223:0.780534
## 19 0.331292:0.671789:0.555484:... Pre-B_cell_CD34- 0.139321:0.121342
## labels pruned.labels
## <character> <character>
## 1 T_cells T_cells
## 2 Monocyte Monocyte
## 3 B_cell B_cell
## 4 T_cells T_cells
## 5 T_cells T_cells
## ... ... ...
## 15 BM & Prog. BM & Prog.
## 16 B_cell B_cell
## 17 B_cell NA
## 18 Pro-B_cell_CD34+ Pro-B_cell_CD34+
## 19 GMP GMPSession Info
R version 4.0.4 (2021-02-15)
Platform: x86_64-pc-linux-gnu (64-bit)
Running under: Ubuntu 20.04.2 LTS

Matrix products: default
BLAS:   /home/biocbuild/bbs-3.12-books/R/lib/libRblas.so
LAPACK: /home/biocbuild/bbs-3.12-books/R/lib/libRlapack.so

locale:
 [1] LC_CTYPE=en_US.UTF-8       LC_NUMERIC=C
 [3] LC_TIME=en_US.UTF-8        LC_COLLATE=C
 [5] LC_MONETARY=en_US.UTF-8    LC_MESSAGES=en_US.UTF-8
 [7] LC_PAPER=en_US.UTF-8       LC_NAME=C
 [9] LC_ADDRESS=C               LC_TELEPHONE=C
[11] LC_MEASUREMENT=en_US.UTF-8 LC_IDENTIFICATION=C

attached base packages:
[1] parallel  stats4    stats     graphics  grDevices utils     datasets
[8] methods   base

other attached packages:
 [1] SingleR_1.4.1               celldex_1.0.0
 [3] pheatmap_1.0.12             bluster_1.0.0
 [5] BiocNeighbors_1.8.2         batchelor_1.6.2
 [7] scran_1.18.5                BiocParallel_1.24.1
 [9] scater_1.18.6               ggplot2_3.3.3
[11] EnsDb.Hsapiens.v86_2.99.0   ensembldb_2.14.0
[13] AnnotationFilter_1.14.0     GenomicFeatures_1.42.2
[15] AnnotationDbi_1.52.0        rhdf5_2.34.0
[17] HCAData_1.6.0               SingleCellExperiment_1.12.0
[19] SummarizedExperiment_1.20.0 Biobase_2.50.0
[21] GenomicRanges_1.42.0        GenomeInfoDb_1.26.4
[23] IRanges_2.24.1              S4Vectors_0.28.1
[25] BiocGenerics_0.36.0         MatrixGenerics_1.2.1
[27] matrixStats_0.58.0          BiocStyle_2.18.1
[29] rebook_1.0.0

loaded via a namespace (and not attached):
  [1] AnnotationHub_2.22.0          BiocFileCache_1.14.0
  [3] igraph_1.2.6                  lazyeval_0.2.2
  [5] digest_0.6.27                 htmltools_0.5.1.1
  [7] viridis_0.5.1                 fansi_0.4.2
  [9] magrittr_2.0.1                memoise_2.0.0
 [11] limma_3.46.0                  Biostrings_2.58.0
 [13] askpass_1.1                   prettyunits_1.1.1
 [15] colorspace_2.0-0              blob_1.2.1
 [17] rappdirs_0.3.3                xfun_0.22
 [19] dplyr_1.0.5                   callr_3.5.1
 [21] crayon_1.4.1                  RCurl_1.98-1.3
 [23] jsonlite_1.7.2                graph_1.68.0
 [25] glue_1.4.2                    gtable_0.3.0
 [27] zlibbioc_1.36.0               XVector_0.30.0
 [29] DelayedArray_0.16.2           BiocSingular_1.6.0
 [31] Rhdf5lib_1.12.1               HDF5Array_1.18.1
 [33] scales_1.1.1                  edgeR_3.32.1
 [35] DBI_1.1.1                     Rcpp_1.0.6
 [37] viridisLite_0.3.0             xtable_1.8-4
 [39] progress_1.2.2                dqrng_0.2.1
 [41] bit_4.0.4                     rsvd_1.0.3
 [43] ResidualMatrix_1.0.0          httr_1.4.2
 [45] RColorBrewer_1.1-2            ellipsis_0.3.1
 [47] pkgconfig_2.0.3               XML_3.99-0.6
 [49] farver_2.1.0                  scuttle_1.0.4
 [51] uwot_0.1.10                   CodeDepends_0.6.5
 [53] sass_0.3.1                    dbplyr_2.1.0
 [55] locfit_1.5-9.4                utf8_1.2.1
 [57] labeling_0.4.2                tidyselect_1.1.0
 [59] rlang_0.4.10                  later_1.1.0.1
 [61] munsell_0.5.0                 BiocVersion_3.12.0
 [63] tools_4.0.4                   cachem_1.0.4
 [65] generics_0.1.0                RSQLite_2.2.4
 [67] ExperimentHub_1.16.0          evaluate_0.14
 [69] stringr_1.4.0                 fastmap_1.1.0
 [71] yaml_2.2.1                    processx_3.4.5
 [73] knitr_1.31                    bit64_4.0.5
 [75] purrr_0.3.4                   sparseMatrixStats_1.2.1
 [77] mime_0.10                     xml2_1.3.2
 [79] biomaRt_2.46.3                compiler_4.0.4
 [81] beeswarm_0.3.1                curl_4.3
 [83] interactiveDisplayBase_1.28.0 statmod_1.4.35
 [85] tibble_3.1.0                  bslib_0.2.4
 [87] stringi_1.5.3                 highr_0.8
 [89] ps_1.6.0                      RSpectra_0.16-0
 [91] lattice_0.20-41               ProtGenerics_1.22.0
 [93] Matrix_1.3-2                  vctrs_0.3.6
 [95] pillar_1.5.1                  lifecycle_1.0.0
 [97] rhdf5filters_1.2.0            BiocManager_1.30.10
 [99] jquerylib_0.1.3               cowplot_1.1.1
[101] bitops_1.0-6                  irlba_2.3.3
[103] httpuv_1.5.5                  rtracklayer_1.50.0
[105] R6_2.5.0                      bookdown_0.21
[107] promises_1.2.0.1              gridExtra_2.3
[109] vipor_0.4.5                   codetools_0.2-18
[111] assertthat_0.2.1              openssl_1.4.3
[113] withr_2.4.1                   GenomicAlignments_1.26.0
[115] Rsamtools_2.6.0               GenomeInfoDbData_1.2.4
[117] hms_1.0.0                     grid_4.0.4
[119] beachmat_2.6.4                rmarkdown_2.7
[121] DelayedMatrixStats_1.12.3     shiny_1.6.0
[123] ggbeeswarm_0.6.0