Chapter 29 Human PBMC with surface proteins (10X Genomics)
29.1 Introduction
Here, we describe a brief analysis of yet another peripheral blood mononuclear cell (PBMC) dataset from 10X Genomics (Zheng et al. 2017). Data are publicly available from the 10X Genomics website, from which we download the filtered gene/barcode count matrices for gene expression and cell surface proteins. Note that most of the repertoire-related steps will be discussed in Chapter 21, this workflow mostly provides the baseline analysis for the expression data.
29.2 Data loading
library(BiocFileCache)
bfc <- BiocFileCache(ask=FALSE)
exprs.data <- bfcrpath(bfc, file.path(
    "http://cf.10xgenomics.com/samples/cell-vdj/3.1.0",
    "vdj_v1_hs_pbmc3",
    "vdj_v1_hs_pbmc3_filtered_feature_bc_matrix.tar.gz"))
untar(exprs.data, exdir=tempdir())

library(DropletUtils)
sce.pbmc <- read10xCounts(file.path(tempdir(), "filtered_feature_bc_matrix"))
sce.pbmc <- splitAltExps(sce.pbmc, rowData(sce.pbmc)$Type)
29.3 Quality control
We discard cells with high mitochondrial proportions and few detectable ADT counts.
library(scater)
is.mito <- grep("^MT-", rowData(sce.pbmc)$Symbol)
stats <- perCellQCMetrics(sce.pbmc, subsets=list(Mito=is.mito))

high.mito <- isOutlier(stats$subsets_Mito_percent, type="higher")
low.adt <- stats$`altexps_Antibody Capture_detected` < nrow(altExp(sce.pbmc))/2

discard <- high.mito | low.adt
sce.pbmc <- sce.pbmc[,!discard]
We examine some of the statistics:
##    Mode   FALSE    TRUE
## logical 6660 571## Mode FALSE
## logical 7231## Mode FALSE TRUE
## logical 6660 571We examine the distribution of each QC metric (Figure 29.1).
colData(unfiltered) <- cbind(colData(unfiltered), stats)
unfiltered$discard <- discard

gridExtra::grid.arrange(
    plotColData(unfiltered, y="sum", colour_by="discard") +
        scale_y_log10() + ggtitle("Total count"),
    plotColData(unfiltered, y="detected", colour_by="discard") +
        scale_y_log10() + ggtitle("Detected features"),
    plotColData(unfiltered, y="subsets_Mito_percent",
        colour_by="discard") + ggtitle("Mito percent"),
    plotColData(unfiltered, y="altexps_Antibody Capture_detected",
        colour_by="discard") + ggtitle("ADT detected"),
    ncol=2
)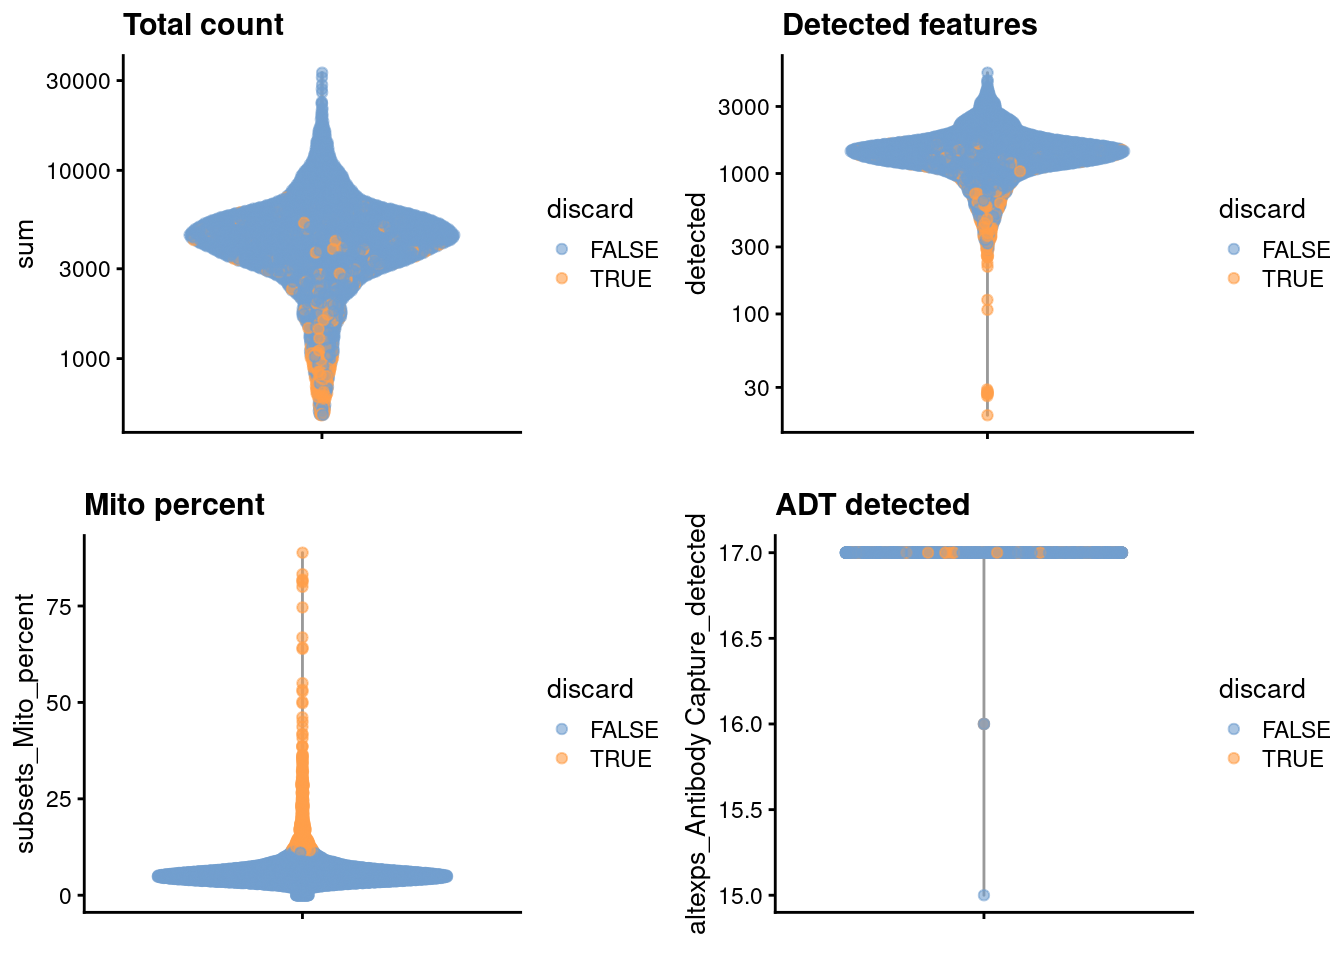
Figure 29.1: Distribution of each QC metric in the PBMC dataset, where each point is a cell and is colored by whether or not it was discarded by the outlier-based QC approach.
We also plot the mitochondrial proportion against the total count for each cell, as one does (Figure 29.2).
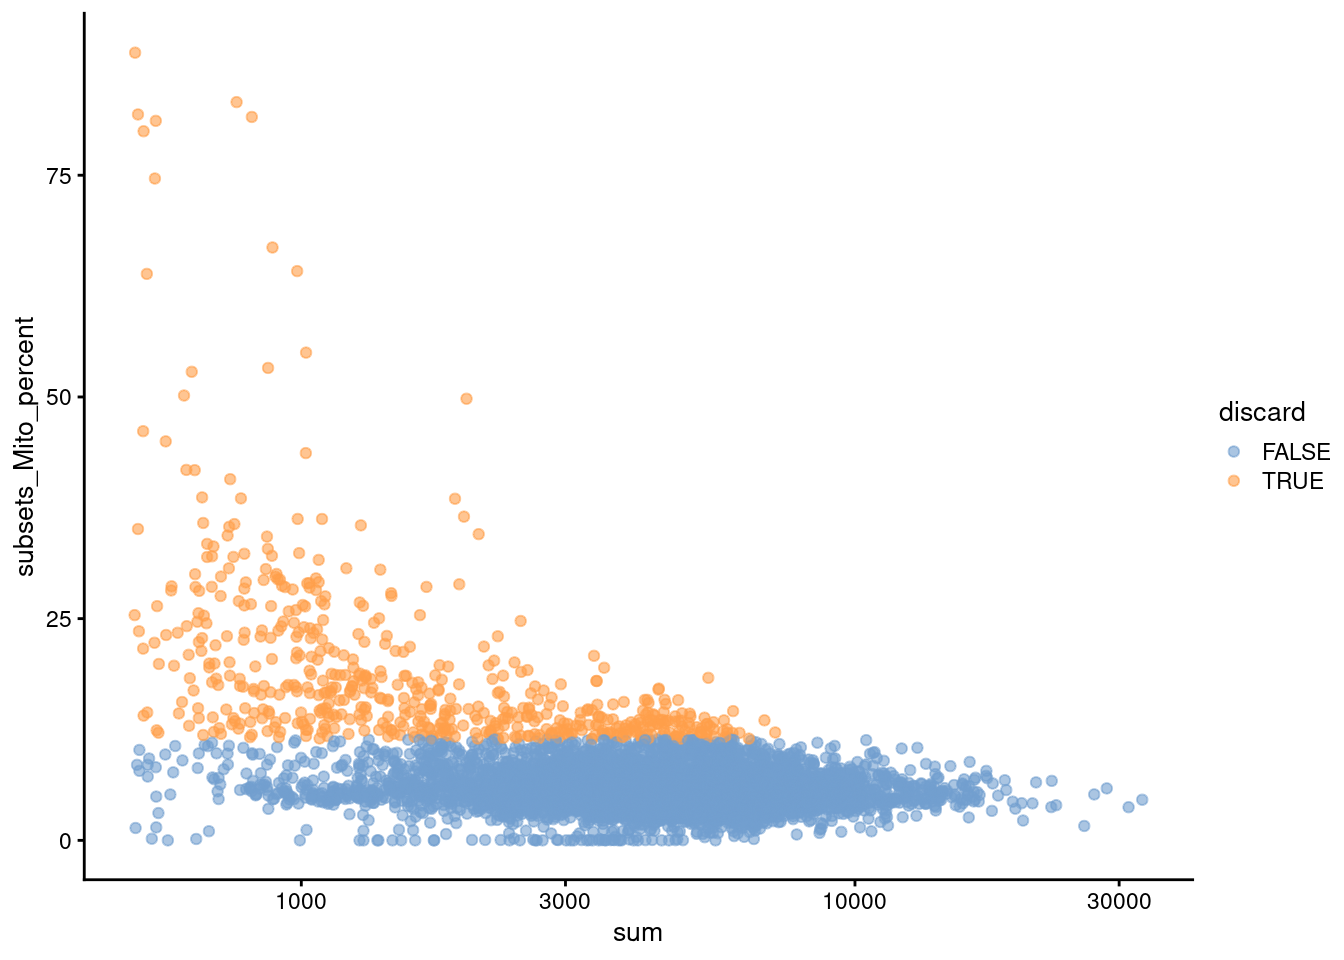
Figure 29.2: Percentage of UMIs mapped to mitochondrial genes against the totalcount for each cell.
29.4 Normalization
Computing size factors for the gene expression and ADT counts.
library(scran)

set.seed(1000)
clusters <- quickCluster(sce.pbmc)
sce.pbmc <- computeSumFactors(sce.pbmc, cluster=clusters)
altExp(sce.pbmc) <- computeMedianFactors(altExp(sce.pbmc))
sce.pbmc <- logNormCounts(sce.pbmc, use_altexps=TRUE)
We generate some summary statistics for both sets of size factors:
##    Min. 1st Qu.  Median    Mean 3rd Qu.    Max.
## 0.074 0.719 0.908 1.000 1.133 8.858## Min. 1st Qu. Median Mean 3rd Qu. Max.
## 0.10 0.70 0.83 1.00 1.03 227.36We also look at the distribution of size factors compared to the library size for each set of features (Figure 29.3).
par(mfrow=c(1,2))
plot(librarySizeFactors(sce.pbmc), sizeFactors(sce.pbmc), pch=16,
    xlab="Library size factors", ylab="Deconvolution factors",
    main="Gene expression", log="xy")
plot(librarySizeFactors(altExp(sce.pbmc)), sizeFactors(altExp(sce.pbmc)), pch=16,
    xlab="Library size factors", ylab="Median-based factors",
    main="Antibody capture", log="xy")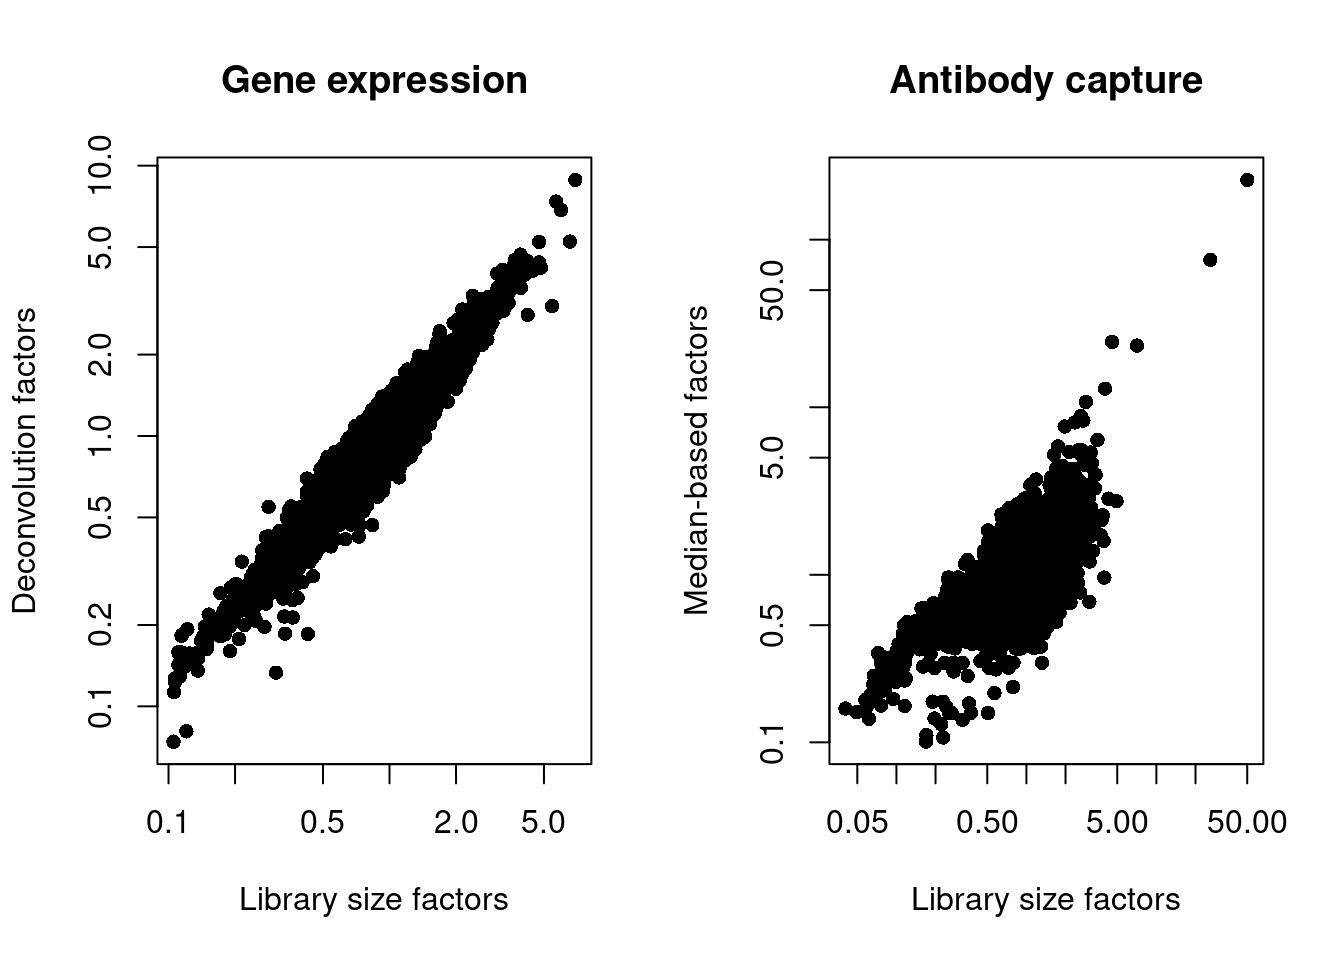
Figure 29.3: Plot of the deconvolution size factors for the gene expression values (left) or the median-based size factors for the ADT expression values (right) compared to the library size-derived factors for the corresponding set of features. Each point represents a cell.
29.5 Dimensionality reduction
We omit the PCA step for the ADT expression matrix, given that it is already so low-dimensional, and progress directly to \(t\)-SNE and UMAP visualizations.
29.6 Clustering
We perform graph-based clustering on the ADT data and use the assignments as the column labels of the alternative Experiment.
g.adt <- buildSNNGraph(altExp(sce.pbmc), k=10, d=NA)
clust.adt <- igraph::cluster_walktrap(g.adt)$membership
colLabels(altExp(sce.pbmc)) <- factor(clust.adt)
We examine some basic statistics about the size of each cluster, their separation (Figure 29.4) and their distribution in our \(t\)-SNE plot (Figure 29.5).
##
##    1    2    3    4    5    6    7    8    9   10   11   12   13   14   15   16
##  160  507  662   39  691 1415   32  650   76 1037  121   47   68   25   15  562
##   17   18   19   20   21   22   23   24
## 139 32 44 120 84 65 52 17library(bluster)
mod <- pairwiseModularity(g.adt, clust.adt, as.ratio=TRUE)
library(pheatmap)
pheatmap::pheatmap(log10(mod + 10), cluster_row=FALSE, cluster_col=FALSE,
color=colorRampPalette(c("white", "blue"))(101))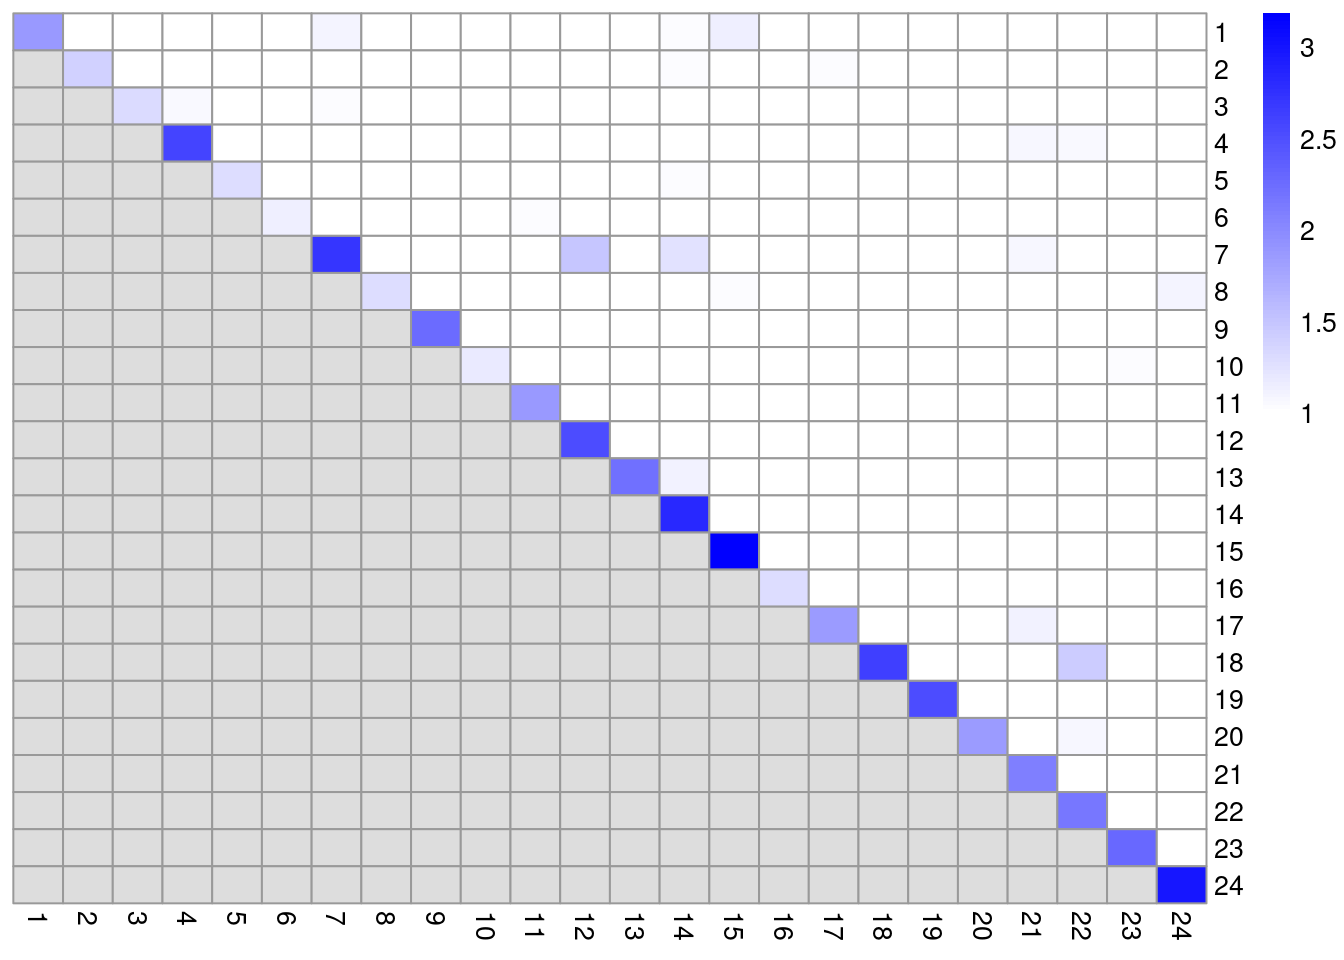
Figure 29.4: Heatmap of the pairwise cluster modularity scores in the PBMC dataset, computed based on the shared nearest neighbor graph derived from the ADT expression values.
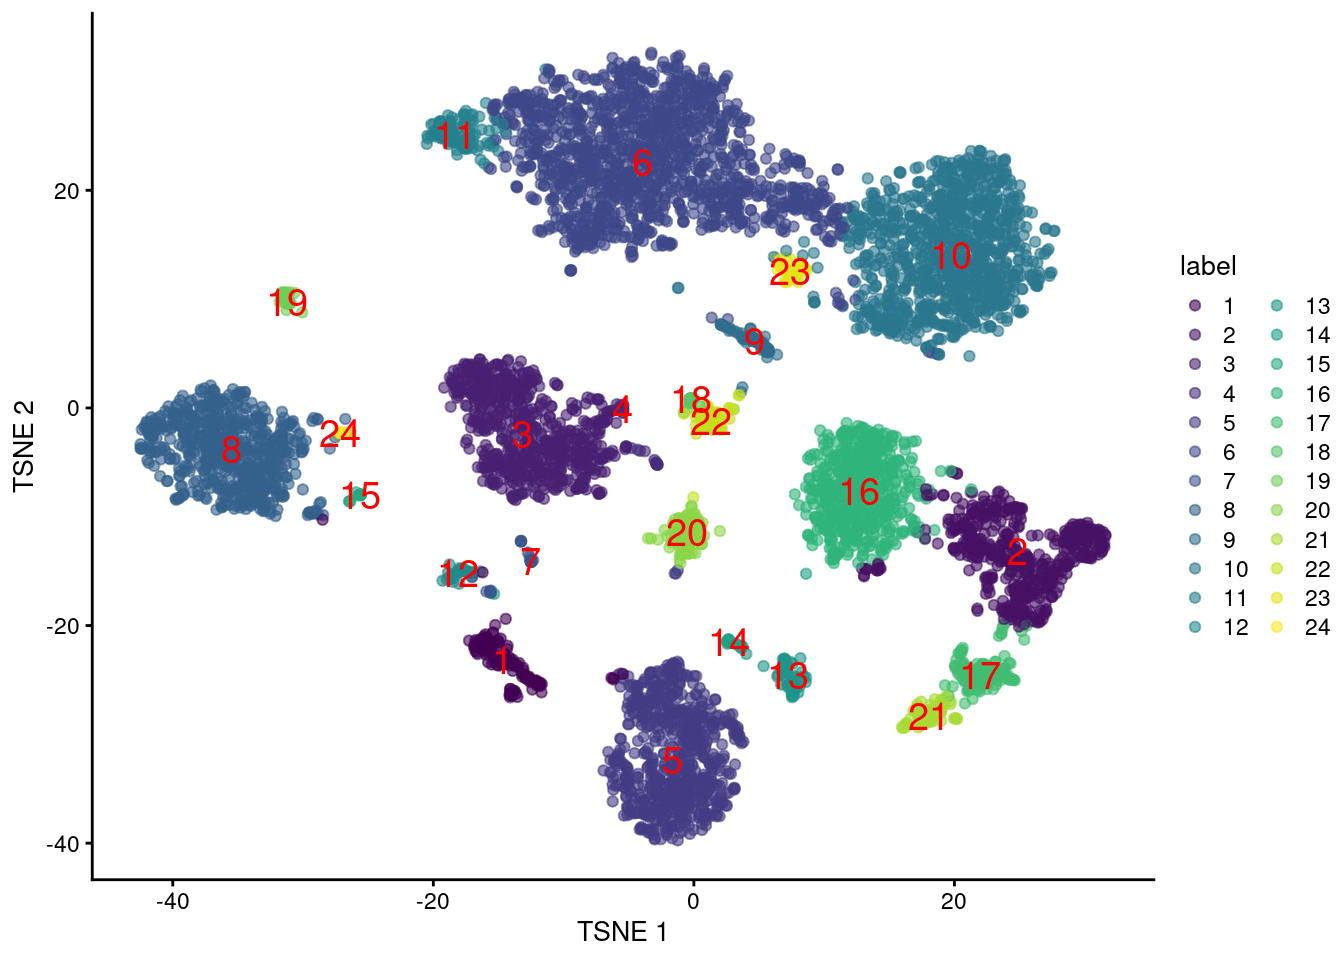
Figure 29.5: Obligatory \(t\)-SNE plot of PBMC dataset based on its ADT expression values, where each point is a cell and is colored by the cluster of origin. Cluster labels are also overlaid at the median coordinates across all cells in the cluster.
We perform some additional subclustering using the expression data to mimic an in silico FACS experiment.
set.seed(1010010)
subclusters <- quickSubCluster(sce.pbmc, clust.adt,
    prepFUN=function(x) {
        dec <- modelGeneVarByPoisson(x)
        top <- getTopHVGs(dec, prop=0.1)
        denoisePCA(x, dec, subset.row=top)
    },
    clusterFUN=function(x) {
        g.gene <- buildSNNGraph(x, k=10, use.dimred = 'PCA')
        igraph::cluster_walktrap(g.gene)$membership
    }
)
We counting the number of gene expression-derived subclusters in each ADT-derived parent cluster.
data.frame(
    Cluster=names(subclusters),
    Ncells=vapply(subclusters, ncol, 0L),
    Nsub=vapply(subclusters, function(x) length(unique(x$subcluster)), 0L)
)
## Cluster Ncells Nsub
## 1 1 160 3
## 2 2 507 4
## 3 3 662 5
## 4 4 39 1
## 5 5 691 5
## 6 6 1415 7
## 7 7 32 1
## 8 8 650 7
## 9 9 76 2
## 10 10 1037 8
## 11 11 121 2
## 12 12 47 1
## 13 13 68 2
## 14 14 25 1
## 15 15 15 1
## 16 16 562 9
## 17 17 139 3
## 18 18 32 1
## 19 19 44 1
## 20 20 120 4
## 21 21 84 3
## 22 22 65 2
## 23 23 52 3
## 24 24 17 1Session Info
R version 4.0.4 (2021-02-15)
Platform: x86_64-pc-linux-gnu (64-bit)
Running under: Ubuntu 20.04.2 LTS

Matrix products: default
BLAS:   /home/biocbuild/bbs-3.12-books/R/lib/libRblas.so
LAPACK: /home/biocbuild/bbs-3.12-books/R/lib/libRlapack.so

locale:
 [1] LC_CTYPE=en_US.UTF-8       LC_NUMERIC=C
 [3] LC_TIME=en_US.UTF-8        LC_COLLATE=C
 [5] LC_MONETARY=en_US.UTF-8    LC_MESSAGES=en_US.UTF-8
 [7] LC_PAPER=en_US.UTF-8       LC_NAME=C
 [9] LC_ADDRESS=C               LC_TELEPHONE=C
[11] LC_MEASUREMENT=en_US.UTF-8 LC_IDENTIFICATION=C

attached base packages:
[1] parallel  stats4    stats     graphics  grDevices utils     datasets
[8] methods   base

other attached packages:
 [1] pheatmap_1.0.12             bluster_1.0.0
 [3] scran_1.18.5                scater_1.18.6
 [5] ggplot2_3.3.3               DropletUtils_1.10.3
 [7] SingleCellExperiment_1.12.0 SummarizedExperiment_1.20.0
 [9] Biobase_2.50.0              GenomicRanges_1.42.0
[11] GenomeInfoDb_1.26.4         IRanges_2.24.1
[13] S4Vectors_0.28.1            BiocGenerics_0.36.0
[15] MatrixGenerics_1.2.1        matrixStats_0.58.0
[17] BiocFileCache_1.14.0        dbplyr_2.1.0
[19] BiocStyle_2.18.1            rebook_1.0.0

loaded via a namespace (and not attached):
  [1] Rtsne_0.15                ggbeeswarm_0.6.0
  [3] colorspace_2.0-0          ellipsis_0.3.1
  [5] scuttle_1.0.4             XVector_0.30.0
  [7] BiocNeighbors_1.8.2       farver_2.1.0
  [9] bit64_4.0.5               RSpectra_0.16-0
 [11] fansi_0.4.2               codetools_0.2-18
 [13] R.methodsS3_1.8.1         sparseMatrixStats_1.2.1
 [15] cachem_1.0.4              knitr_1.31
 [17] jsonlite_1.7.2            R.oo_1.24.0
 [19] uwot_0.1.10               graph_1.68.0
 [21] HDF5Array_1.18.1          BiocManager_1.30.10
 [23] compiler_4.0.4            httr_1.4.2
 [25] dqrng_0.2.1               assertthat_0.2.1
 [27] Matrix_1.3-2              fastmap_1.1.0
 [29] limma_3.46.0              BiocSingular_1.6.0
 [31] htmltools_0.5.1.1         tools_4.0.4
 [33] igraph_1.2.6              rsvd_1.0.3
 [35] gtable_0.3.0              glue_1.4.2
 [37] GenomeInfoDbData_1.2.4    dplyr_1.0.5
 [39] rappdirs_0.3.3            Rcpp_1.0.6
 [41] jquerylib_0.1.3           vctrs_0.3.6
 [43] rhdf5filters_1.2.0        DelayedMatrixStats_1.12.3
 [45] xfun_0.22                 stringr_1.4.0
 [47] ps_1.6.0                  beachmat_2.6.4
 [49] lifecycle_1.0.0           irlba_2.3.3
 [51] statmod_1.4.35            XML_3.99-0.6
 [53] edgeR_3.32.1              zlibbioc_1.36.0
 [55] scales_1.1.1              rhdf5_2.34.0
 [57] RColorBrewer_1.1-2        yaml_2.2.1
 [59] curl_4.3                  memoise_2.0.0
 [61] gridExtra_2.3             sass_0.3.1
 [63] stringi_1.5.3             RSQLite_2.2.4
 [65] highr_0.8                 BiocParallel_1.24.1
 [67] rlang_0.4.10              pkgconfig_2.0.3
 [69] bitops_1.0-6              evaluate_0.14
 [71] lattice_0.20-41           purrr_0.3.4
 [73] Rhdf5lib_1.12.1           CodeDepends_0.6.5
 [75] labeling_0.4.2            cowplot_1.1.1
 [77] bit_4.0.4                 processx_3.4.5
 [79] tidyselect_1.1.0          RcppAnnoy_0.0.18
 [81] magrittr_2.0.1            bookdown_0.21
 [83] R6_2.5.0                  generics_0.1.0
 [85] DelayedArray_0.16.2       DBI_1.1.1
 [87] pillar_1.5.1              withr_2.4.1
 [89] RCurl_1.98-1.3            tibble_3.1.0
 [91] crayon_1.4.1              utf8_1.2.1
 [93] rmarkdown_2.7             viridis_0.5.1
 [95] locfit_1.5-9.4            grid_4.0.4
 [97] blob_1.2.1                callr_3.5.1
 [99] digest_0.6.27             R.utils_2.10.1
[101] munsell_0.5.0             beeswarm_0.3.1
[103] viridisLite_0.3.0         vipor_0.4.5
[105] bslib_0.2.4
Bibliography
Zheng, G. X., J. M. Terry, P. Belgrader, P. Ryvkin, Z. W. Bent, R. Wilson, S. B. Ziraldo, et al. 2017. “Massively parallel digital transcriptional profiling of single cells.” Nat Commun 8 (January): 14049.