Chapter 9 Grun mouse HSC (CEL-seq)
9.1 Introduction
This performs an analysis of the mouse haematopoietic stem cell (HSC) dataset generated with CEL-seq (Grun et al. 2016). Despite its name, this dataset actually contains both sorted HSCs and a population of micro-dissected bone marrow cells.
9.2 Data loading
library(AnnotationHub)
ens.mm.v97 <- AnnotationHub()[["AH73905"]]
anno <- select(ens.mm.v97, keys=rownames(sce.grun.hsc),
    keytype="GENEID", columns=c("SYMBOL", "SEQNAME"))
rowData(sce.grun.hsc) <- anno[match(rownames(sce.grun.hsc), anno$GENEID),]
After loading and annotation, we inspect the resulting SingleCellExperiment object:
## class: SingleCellExperiment
## dim: 21817 1915
## metadata(0):
## assays(1): counts
## rownames(21817): ENSMUSG00000109644 ENSMUSG00000007777 ...
##   ENSMUSG00000055670 ENSMUSG00000039068
## rowData names(3): GENEID SYMBOL SEQNAME
## colnames(1915): JC4_349_HSC_FE_S13_ JC4_350_HSC_FE_S13_ ...
##   JC48P6_1203_HSC_FE_S8_ JC48P6_1204_HSC_FE_S8_
## colData names(2): sample protocol
## reducedDimNames(0):
## mainExpName: NULL
## altExpNames(0):
9.3 Quality control
For some reason, no mitochondrial transcripts are available, and we have no spike-in transcripts, so we only use the number of detected genes and the library size for quality control. We block on the protocol used for cell extraction, ignoring the micro-dissected cells when computing this threshold. This is based on our judgement that a majority of micro-dissected plates consist of a majority of low-quality cells, compromising the assumptions of outlier detection.
library(scuttle)
stats <- perCellQCMetrics(sce.grun.hsc)
qc <- quickPerCellQC(stats, batch=sce.grun.hsc$protocol,
    subset=grepl("sorted", sce.grun.hsc$protocol))
sce.grun.hsc <- sce.grun.hsc[,!qc$discard]
We examine the number of cells discarded for each reason.
##   low_lib_size low_n_features        discard
##            465            482            488
We create some diagnostic plots for each metric (Figure 9.1). The library sizes are unusually low for many plates of micro-dissected cells; this may be attributable to damage induced by the extraction protocol compared to cell sorting.
colData(unfiltered) <- cbind(colData(unfiltered), stats)
unfiltered$discard <- qc$discard

library(scater)
gridExtra::grid.arrange(
    plotColData(unfiltered, y="sum", x="sample", colour_by="discard",
        other_fields="protocol") + scale_y_log10() + ggtitle("Total count") +
        facet_wrap(~protocol),
    plotColData(unfiltered, y="detected", x="sample", colour_by="discard",
        other_fields="protocol") + scale_y_log10() +
        ggtitle("Detected features") + facet_wrap(~protocol),
    ncol=1
)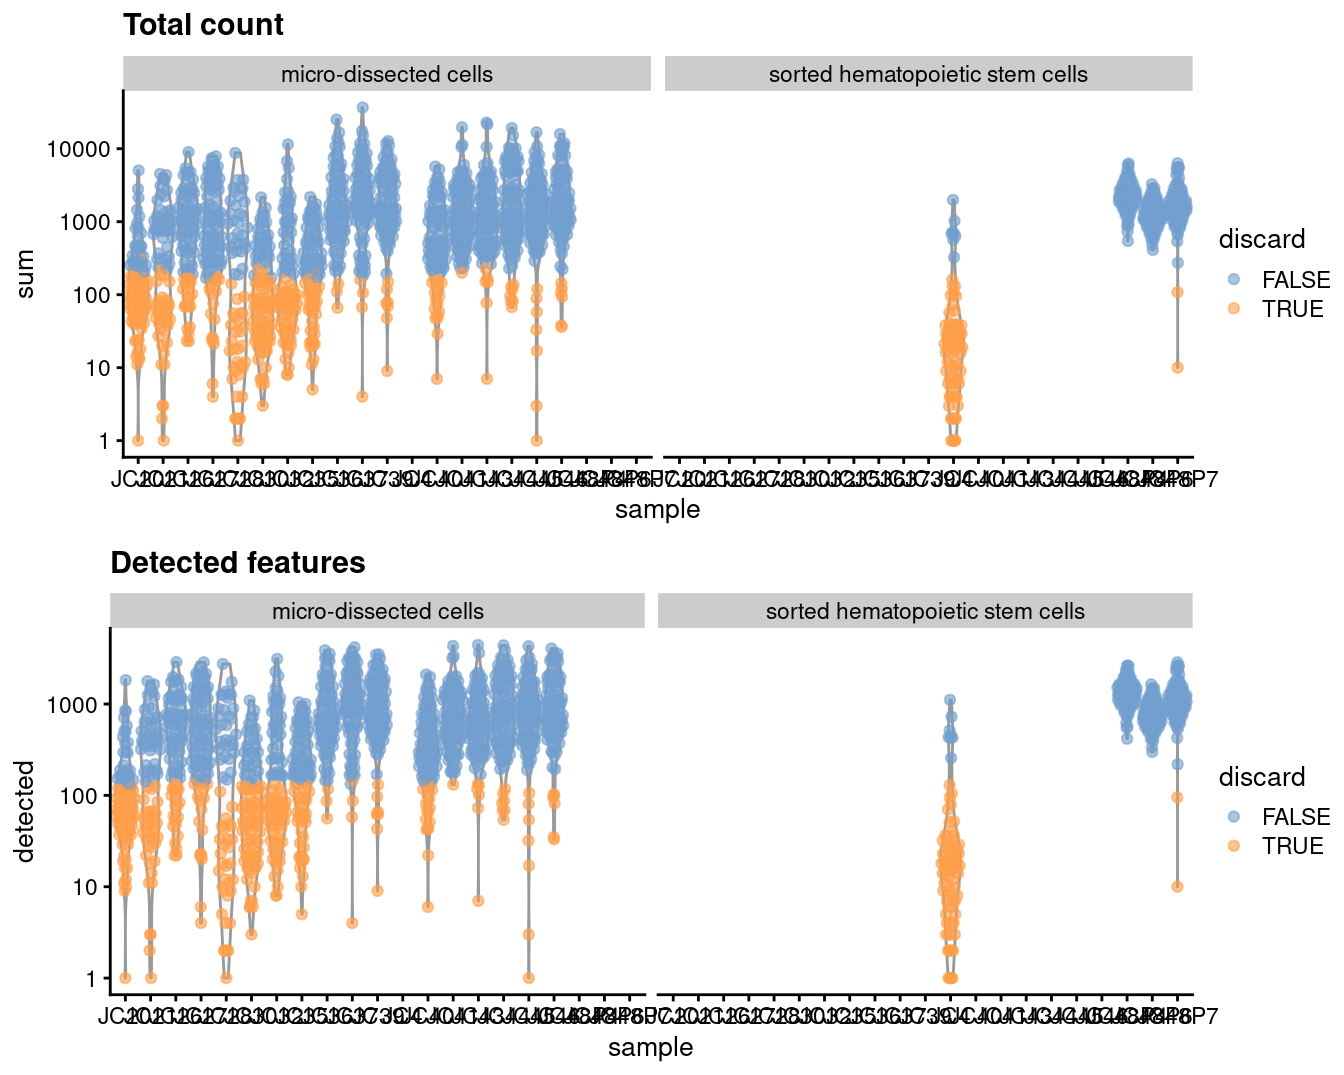
Figure 9.1: Distribution of each QC metric across cells in the Grun HSC dataset. Each point represents a cell and is colored according to whether that cell was discarded.
9.4 Normalization
library(scran)
set.seed(101000110)
clusters <- quickCluster(sce.grun.hsc)
sce.grun.hsc <- computeSumFactors(sce.grun.hsc, clusters=clusters)
sce.grun.hsc <- logNormCounts(sce.grun.hsc)
We examine some key metrics for the distribution of size factors, and compare it to the library sizes as a sanity check (Figure 9.2).
##    Min. 1st Qu.  Median    Mean 3rd Qu.    Max.
## 0.027 0.290 0.603 1.000 1.201 16.433plot(librarySizeFactors(sce.grun.hsc), sizeFactors(sce.grun.hsc), pch=16,
xlab="Library size factors", ylab="Deconvolution factors", log="xy")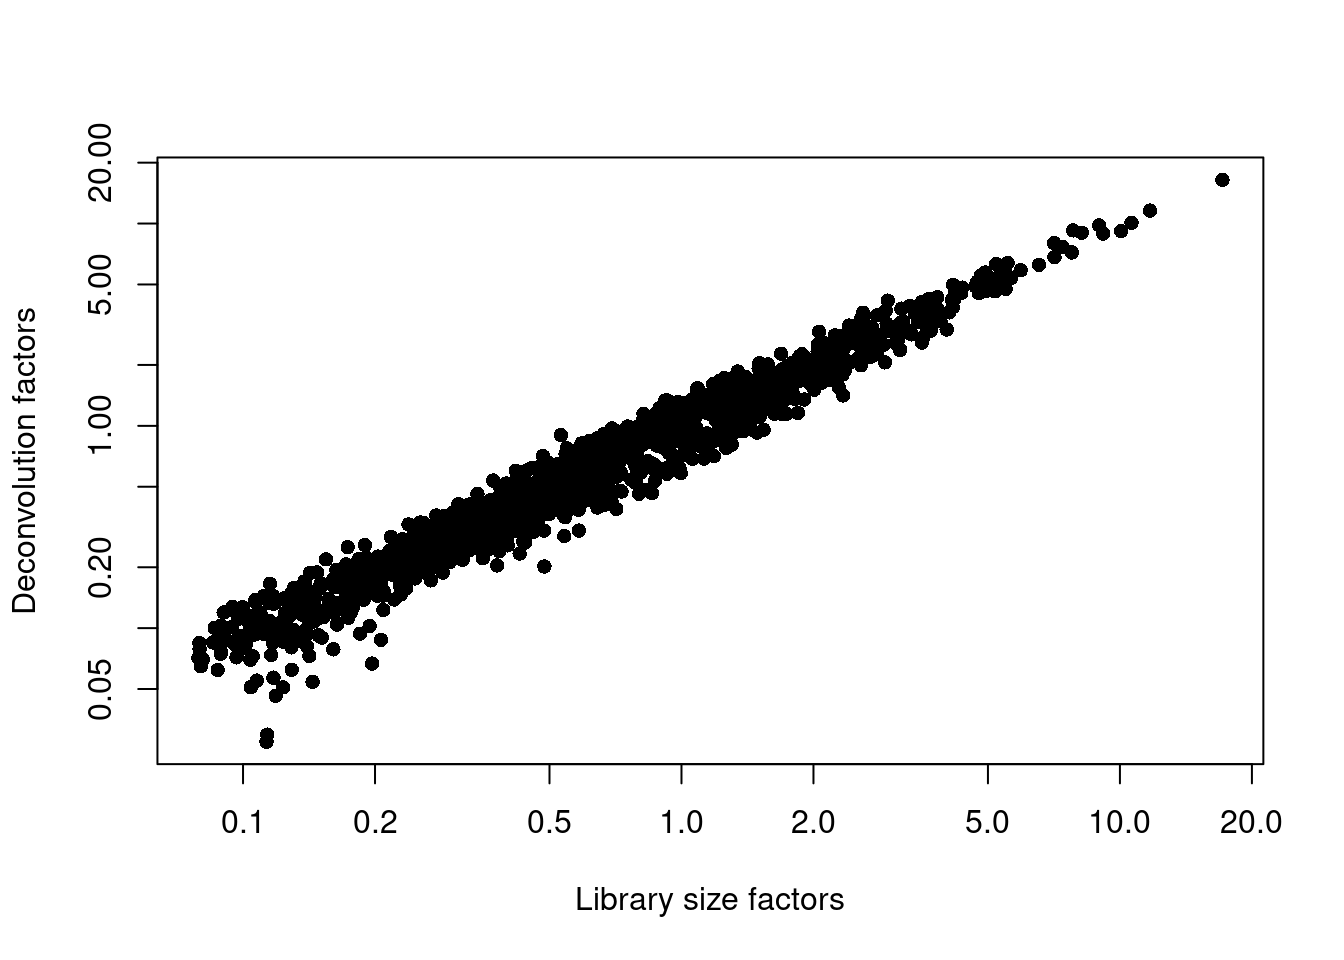
Figure 9.2: Relationship between the library size factors and the deconvolution size factors in the Grun HSC dataset.
9.5 Variance modelling
We create a mean-variance trend based on the expectation that UMI counts have Poisson technical noise. We do not block on sample here as we want to preserve any difference between the micro-dissected cells and the sorted HSCs.
set.seed(00010101)
dec.grun.hsc <- modelGeneVarByPoisson(sce.grun.hsc)
top.grun.hsc <- getTopHVGs(dec.grun.hsc, prop=0.1)
The lack of a typical “bump” shape in Figure 9.3 is caused by the low counts.
plot(dec.grun.hsc$mean, dec.grun.hsc$total, pch=16, cex=0.5,
    xlab="Mean of log-expression", ylab="Variance of log-expression")
curfit <- metadata(dec.grun.hsc)
curve(curfit$trend(x), col='dodgerblue', add=TRUE, lwd=2)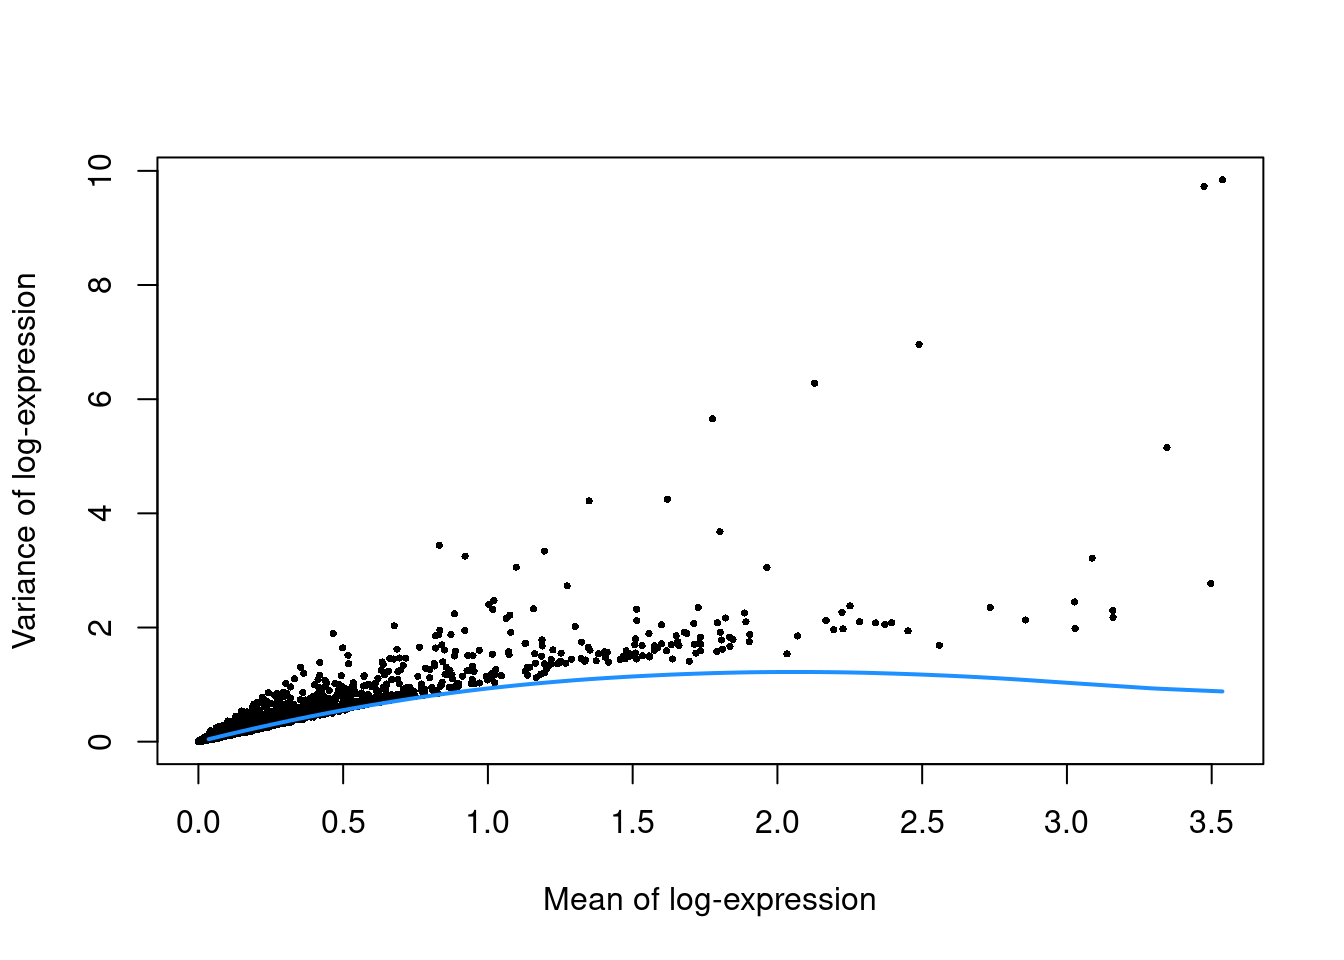
Figure 9.3: Per-gene variance as a function of the mean for the log-expression values in the Grun HSC dataset. Each point represents a gene (black) with the mean-variance trend (blue) fitted to the simulated Poisson-distributed noise.
9.6 Dimensionality reduction
set.seed(101010011)
sce.grun.hsc <- denoisePCA(sce.grun.hsc, technical=dec.grun.hsc, subset.row=top.grun.hsc)
sce.grun.hsc <- runTSNE(sce.grun.hsc, dimred="PCA")
We check that the number of retained PCs is sensible.
## [1] 99.7 Clustering
snn.gr <- buildSNNGraph(sce.grun.hsc, use.dimred="PCA")
colLabels(sce.grun.hsc) <- factor(igraph::cluster_walktrap(snn.gr)$membership)##
## 1 2 3 4 5 6 7 8 9 10 11 12
## 259 148 221 103 177 108 48 122 98 63 62 18short <- ifelse(grepl("micro", sce.grun.hsc$protocol), "micro", "sorted")
gridExtra:::grid.arrange(
plotTSNE(sce.grun.hsc, colour_by="label"),
plotTSNE(sce.grun.hsc, colour_by=I(short)),
ncol=2
)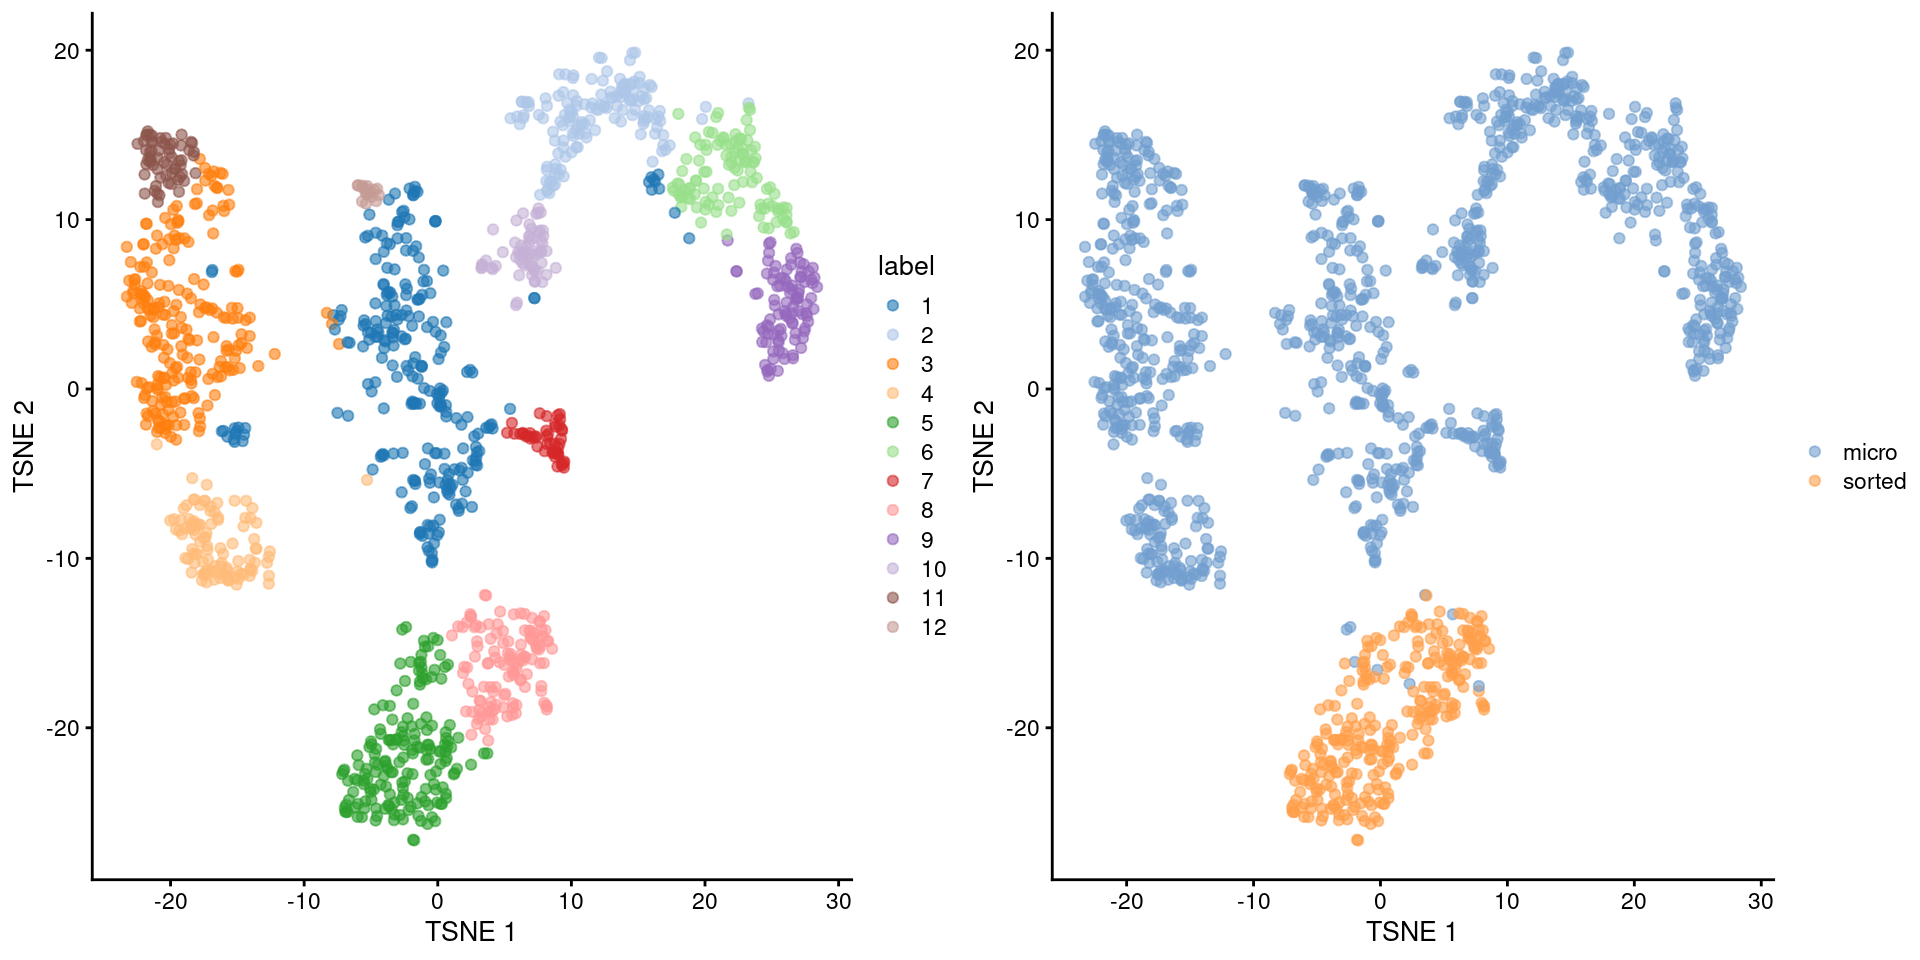
Figure 9.4: Obligatory \(t\)-SNE plot of the Grun HSC dataset, where each point represents a cell and is colored according to the assigned cluster (left) or extraction protocol (right).
9.8 Marker gene detection
markers <- findMarkers(sce.grun.hsc, test.type="wilcox", direction="up",
    row.data=rowData(sce.grun.hsc)[,"SYMBOL",drop=FALSE])
To illustrate the manual annotation process, we examine the marker genes for one of the clusters. Upregulation of Camp, Lcn2, Ltf and lysozyme genes indicates that this cluster contains cells of neuronal origin.
chosen <- markers[['6']]
best <- chosen[chosen$Top <= 10,]
aucs <- getMarkerEffects(best, prefix="AUC")
rownames(aucs) <- best$SYMBOL

library(pheatmap)
pheatmap(aucs, color=viridis::plasma(100))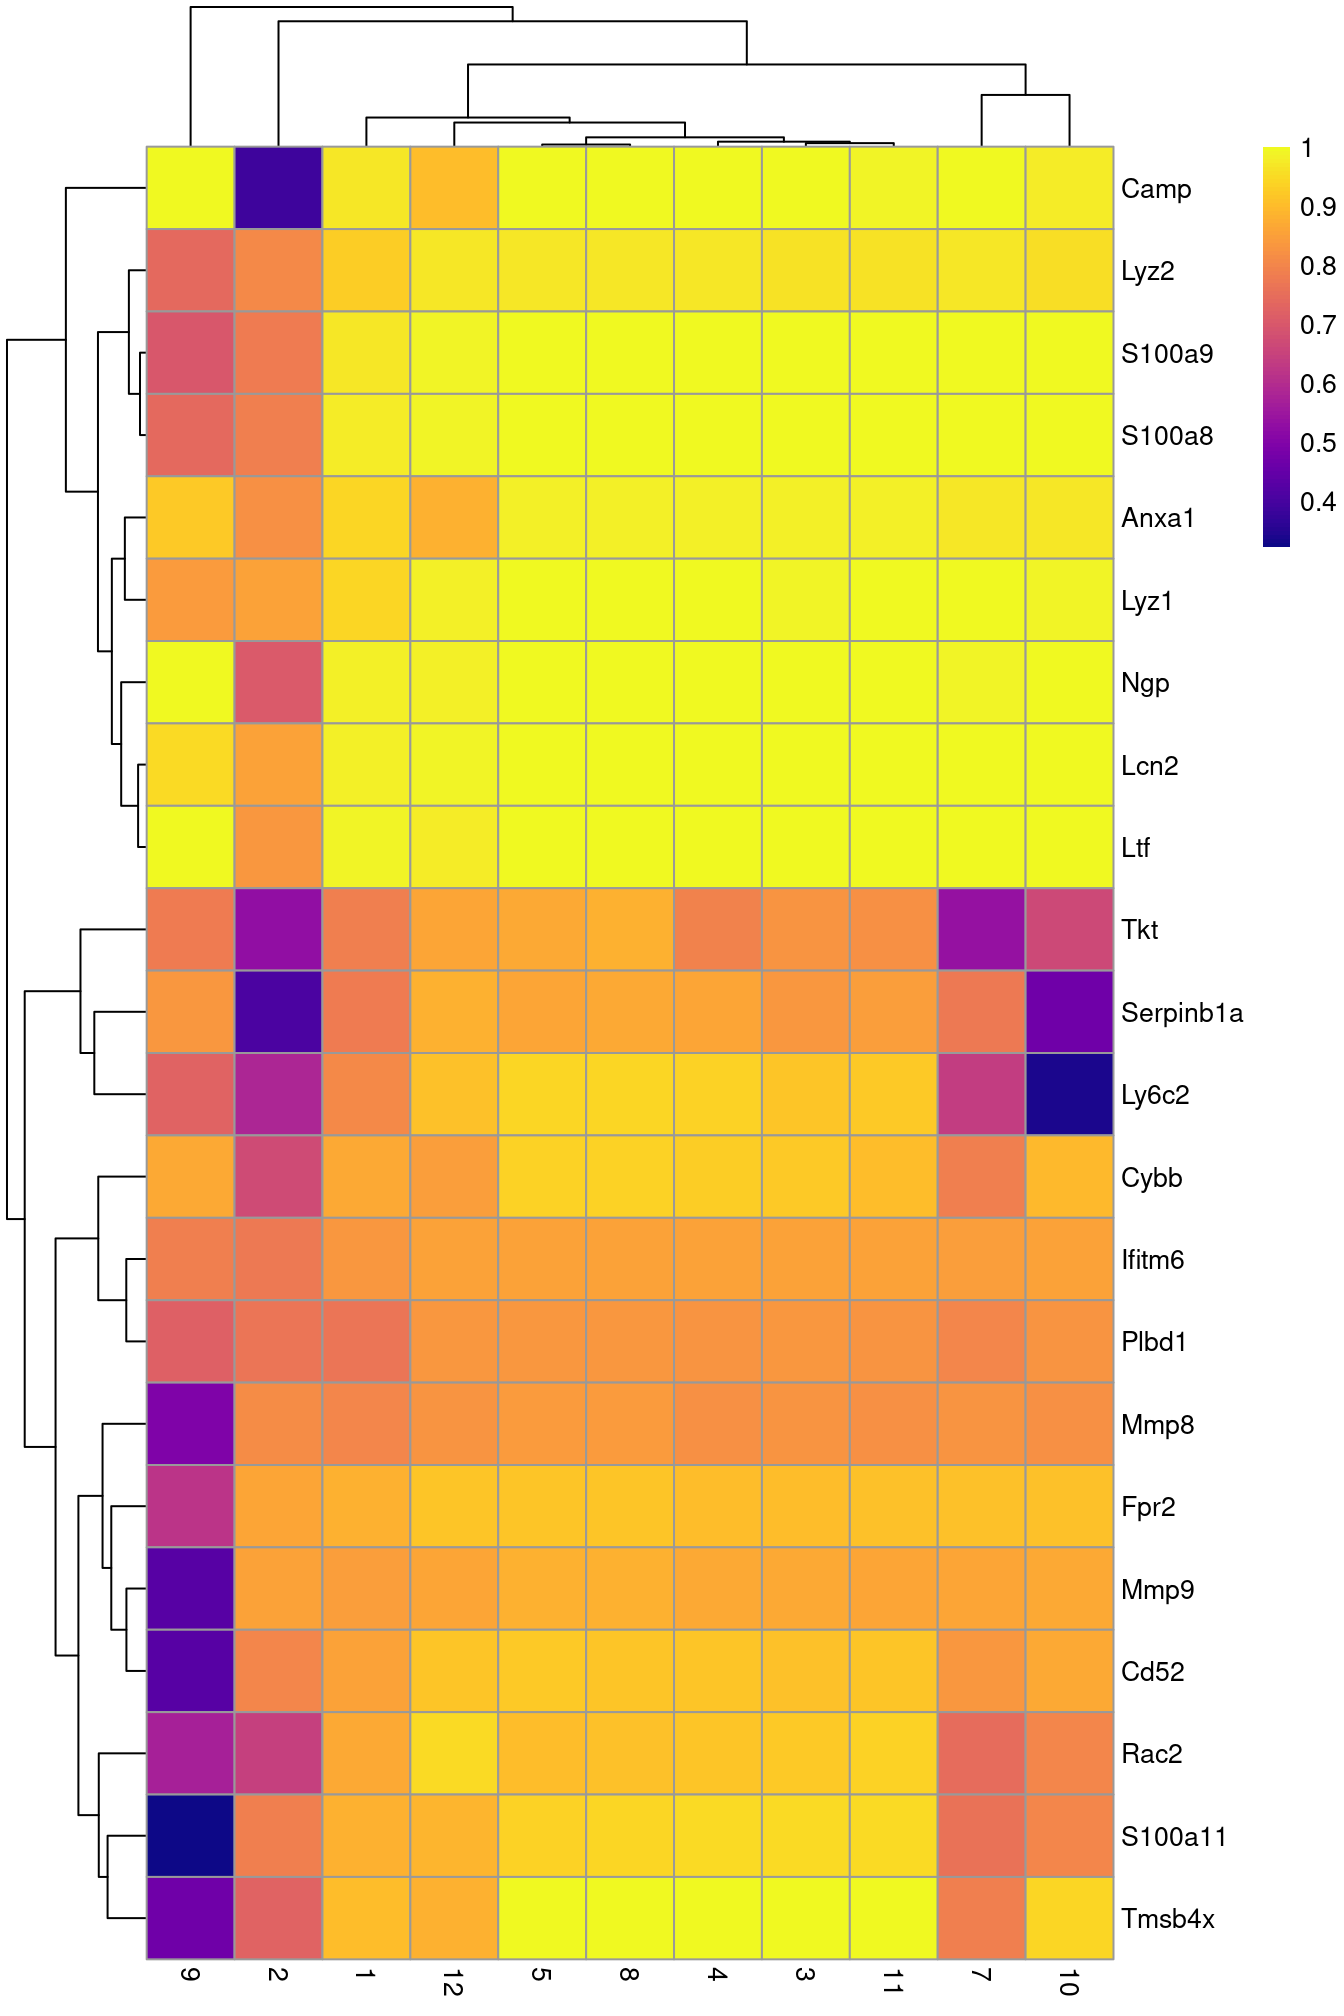
Figure 9.5: Heatmap of the AUCs for the top marker genes in cluster 6 compared to all other clusters in the Grun HSC dataset.
Session Info
R version 4.2.1 (2022-06-23)
Platform: x86_64-pc-linux-gnu (64-bit)
Running under: Ubuntu 20.04.5 LTS

Matrix products: default
BLAS:   /home/biocbuild/bbs-3.15-bioc/R/lib/libRblas.so
LAPACK: /home/biocbuild/bbs-3.15-bioc/R/lib/libRlapack.so

locale:
 [1] LC_CTYPE=en_US.UTF-8       LC_NUMERIC=C
 [3] LC_TIME=en_GB              LC_COLLATE=C
 [5] LC_MONETARY=en_US.UTF-8    LC_MESSAGES=en_US.UTF-8
 [7] LC_PAPER=en_US.UTF-8       LC_NAME=C
 [9] LC_ADDRESS=C               LC_TELEPHONE=C
[11] LC_MEASUREMENT=en_US.UTF-8 LC_IDENTIFICATION=C

attached base packages:
[1] stats4    stats     graphics  grDevices utils     datasets  methods
[8] base

other attached packages:
 [1] pheatmap_1.0.12             scran_1.24.1
 [3] scater_1.24.0               ggplot2_3.3.6
 [5] scuttle_1.6.3               AnnotationHub_3.4.0
 [7] BiocFileCache_2.4.0         dbplyr_2.2.1
 [9] ensembldb_2.20.2            AnnotationFilter_1.20.0
[11] GenomicFeatures_1.48.4      AnnotationDbi_1.58.0
[13] scRNAseq_2.10.0             SingleCellExperiment_1.18.1
[15] SummarizedExperiment_1.26.1 Biobase_2.56.0
[17] GenomicRanges_1.48.0        GenomeInfoDb_1.32.4
[19] IRanges_2.30.1              S4Vectors_0.34.0
[21] BiocGenerics_0.42.0         MatrixGenerics_1.8.1
[23] matrixStats_0.62.0          BiocStyle_2.24.0
[25] rebook_1.6.0

loaded via a namespace (and not attached):
  [1] igraph_1.3.5                  lazyeval_0.2.2
  [3] BiocParallel_1.30.4           digest_0.6.29
  [5] htmltools_0.5.3               viridis_0.6.2
  [7] fansi_1.0.3                   magrittr_2.0.3
  [9] memoise_2.0.1                 ScaledMatrix_1.4.1
 [11] cluster_2.1.4                 limma_3.52.4
 [13] Biostrings_2.64.1             prettyunits_1.1.1
 [15] colorspace_2.0-3              blob_1.2.3
 [17] rappdirs_0.3.3                ggrepel_0.9.1
 [19] xfun_0.33                     dplyr_1.0.10
 [21] crayon_1.5.2                  RCurl_1.98-1.9
 [23] jsonlite_1.8.2                graph_1.74.0
 [25] glue_1.6.2                    gtable_0.3.1
 [27] zlibbioc_1.42.0               XVector_0.36.0
 [29] DelayedArray_0.22.0           BiocSingular_1.12.0
 [31] scales_1.2.1                  edgeR_3.38.4
 [33] DBI_1.1.3                     Rcpp_1.0.9
 [35] viridisLite_0.4.1             xtable_1.8-4
 [37] progress_1.2.2                dqrng_0.3.0
 [39] bit_4.0.4                     rsvd_1.0.5
 [41] metapod_1.4.0                 httr_1.4.4
 [43] RColorBrewer_1.1-3            dir.expiry_1.4.0
 [45] ellipsis_0.3.2                pkgconfig_2.0.3
 [47] XML_3.99-0.11                 farver_2.1.1
 [49] CodeDepends_0.6.5             sass_0.4.2
 [51] locfit_1.5-9.6                utf8_1.2.2
 [53] labeling_0.4.2                tidyselect_1.2.0
 [55] rlang_1.0.6                   later_1.3.0
 [57] munsell_0.5.0                 BiocVersion_3.15.2
 [59] tools_4.2.1                   cachem_1.0.6
 [61] cli_3.4.1                     generics_0.1.3
 [63] RSQLite_2.2.18                ExperimentHub_2.4.0
 [65] evaluate_0.17                 stringr_1.4.1
 [67] fastmap_1.1.0                 yaml_2.3.5
 [69] knitr_1.40                    bit64_4.0.5
 [71] purrr_0.3.5                   KEGGREST_1.36.3
 [73] sparseMatrixStats_1.8.0       mime_0.12
 [75] xml2_1.3.3                    biomaRt_2.52.0
 [77] compiler_4.2.1                beeswarm_0.4.0
 [79] filelock_1.0.2                curl_4.3.3
 [81] png_0.1-7                     interactiveDisplayBase_1.34.0
 [83] statmod_1.4.37                tibble_3.1.8
 [85] bslib_0.4.0                   stringi_1.7.8
 [87] highr_0.9                     bluster_1.6.0
 [89] lattice_0.20-45               ProtGenerics_1.28.0
 [91] Matrix_1.5-1                  vctrs_0.4.2
 [93] pillar_1.8.1                  lifecycle_1.0.3
 [95] BiocManager_1.30.18           jquerylib_0.1.4
 [97] BiocNeighbors_1.14.0          cowplot_1.1.1
 [99] bitops_1.0-7                  irlba_2.3.5.1
[101] httpuv_1.6.6                  rtracklayer_1.56.1
[103] R6_2.5.1                      BiocIO_1.6.0
[105] bookdown_0.29                 promises_1.2.0.1
[107] gridExtra_2.3                 vipor_0.4.5
[109] codetools_0.2-18              assertthat_0.2.1
[111] rjson_0.2.21                  withr_2.5.0
[113] GenomicAlignments_1.32.1      Rsamtools_2.12.0
[115] GenomeInfoDbData_1.2.8        parallel_4.2.1
[117] hms_1.1.2                     grid_4.2.1
[119] beachmat_2.12.0               rmarkdown_2.17
[121] DelayedMatrixStats_1.18.2     Rtsne_0.16
[123] shiny_1.7.2                   ggbeeswarm_0.6.0
[125] restfulr_0.0.15
References
Grun, D., M. J. Muraro, J. C. Boisset, K. Wiebrands, A. Lyubimova, G. Dharmadhikari, M. van den Born, et al. 2016. “De Novo Prediction of Stem Cell Identity using Single-Cell Transcriptome Data.” Cell Stem Cell 19 (2): 266–77.